Note
Go to the end to download the full example code.
Correct a line#
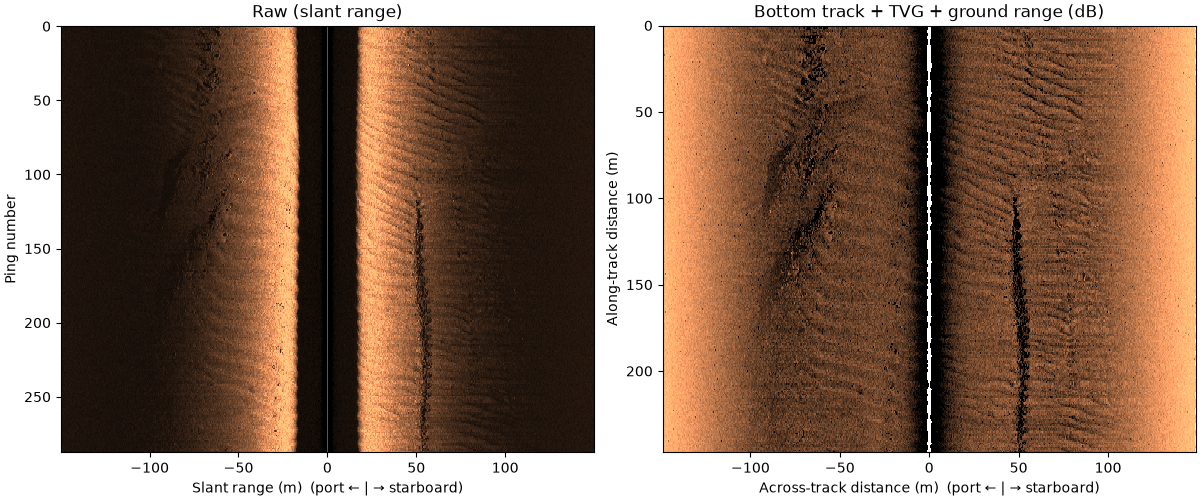
Each correction is one function call on the survey. Every call is
recorded with its parameters in each frequency’s processing_history,
so a corrected file says how it was made; leave a call out to skip that
correction, or put your own function in the chain.
This JNCC line records no altitude above the seabed, which the
slant-to-ground-range step needs.
altitude_from_bottom_track() picks it from
the first seabed return in each ping before
compute_geometric_ranges() runs.
Data: JNCC Wight-Barfleur Reef, Open Government Licence v3.0 (see Example data).
Usage: python examples/gallery/plot_correct_a_line.py [output_dir]
# 2026 rshomberg@uri.edu

import sys
from pathlib import Path

import matplotlib.pyplot as plt
import numpy as np
from matplotlib.patches import Polygon, Rectangle

from sidescanpy import datasets
from sidescanpy.export.georef_window import extract_georef_window, locate_point
from sidescanpy.io import read_and_convert
from sidescanpy.log import configure_logging
from sidescanpy.processing import (
    altitude_from_bottom_track,
    apply_tvg,
    compute_geometric_ranges,
    compute_georeferencing,
    interpolate_aux_onto_pings,
    slice_by_range,
    uncorrected_backscatter,
)
from sidescanpy.processing.navigation import along_track_distance_m
from sidescanpy.viz import plot_waterfall

out = Path(sys.argv[1]) if len(sys.argv) > 1 else Path(".")
out.mkdir(parents=True, exist_ok=True)
configure_logging("INFO")

survey = read_and_convert([datasets.fetch("jncc_wight_barfleur_20130321174522.jsf")], fmt="jsf")
raw = compute_geometric_ranges(survey.get_frequency("hz_521000").dataset.copy(deep=True))
raw = slice_by_range(raw, max_m=150)
21:10:08 WARNING sidescanpy.io.jsf.reader: jncc_wight_barfleur_20130321174522.jsf: skipped 910 message(s) of unsupported type(s) (type: count) 2000: 910
21:10:08 WARNING sidescanpy.io.jsf.converter: 1 incomplete ping(s) detected; repair_mode='nan_pad'
21:10:08 WARNING sidescanpy.processing.sample_axis: 288 of 288 pings have invalid sound_vel_ms (NaN or non-positive); falling back to 1500.0 m/s
21:10:08 WARNING sidescanpy.processing.geometric: 0 of 288 pings have NaN altitude_m (their ground range is NaN) and 288 have altitude_m <= 0 (ground range = slant range); the 'bottom_track' step can fill them from the first bottom return
21:10:08 WARNING sidescanpy.processing.sample_axis: 288 of 288 pings have invalid sound_vel_ms (NaN or non-positive); falling back to 1500.0 m/s
The corrections, in order. Each returns a new survey and leaves its input unchanged.
survey = interpolate_aux_onto_pings(survey)   # navigation and attitude onto the pings
survey = altitude_from_bottom_track(survey)   # altitude from the first seabed return
survey = apply_tvg(survey)                    # spreading and absorption losses
survey = compute_geometric_ranges(survey)     # slant to ground range
survey = compute_georeferencing(survey)       # latitude and longitude per sample
corrected = slice_by_range(survey.get_frequency("hz_521000").dataset, max_m=150)
print(f"altitude from bottom track: {float(corrected['altitude_m'].median()):.1f} m (median)")
21:10:08 WARNING sidescanpy.processing.interpolate: Skipping 'heave_m': 'attitude.heave_m' source is all NaN. Preserving original per-ping value.
21:10:08 WARNING sidescanpy.processing.interpolate: Skipping 'heave_m': 'attitude.heave_m' source is all NaN. Preserving original per-ping value.
21:10:08 WARNING sidescanpy.processing.sample_axis: 288 of 288 pings have invalid sound_vel_ms (NaN or non-positive); falling back to 1500.0 m/s
21:10:08 WARNING sidescanpy.processing.sample_axis: 287 of 287 pings have invalid sound_vel_ms (NaN or non-positive); falling back to 1500.0 m/s
21:10:08 WARNING sidescanpy.processing.sample_axis: 288 of 288 pings have invalid sound_vel_ms (NaN or non-positive); falling back to 1500.0 m/s
21:10:09 WARNING sidescanpy.processing.sample_axis: 287 of 287 pings have invalid sound_vel_ms (NaN or non-positive); falling back to 1500.0 m/s
21:10:15 WARNING sidescanpy.processing.sample_axis: 288 of 288 pings have invalid sound_vel_ms (NaN or non-positive); falling back to 1500.0 m/s
altitude from bottom track: 17.5 m (median)
Left: raw amplitude against slant range. Right: after the bottom track,
time-varying gain (spreading and absorption losses) and slant-to-ground
range, against across-track and along-track distance in metres. The
water column is gone, and the far range is no longer darker than the
near range. apply_tvg returns backscatter_intensity in dB, so the
corrected panel plots it as it is. Both panels average samples down to
about 1000 per side first, close to the figure’s resolution, so fine
texture is averaged rather than skipped.
def for_display(ds):
    """Average samples down to about 1000 per side."""
    return ds.coarsen(sample=max(1, ds.sizes["sample"] // 1000), boundary="trim").mean()


fig, (ax_raw, ax_cor) = plt.subplots(1, 2, figsize=(12, 5), constrained_layout=True)
plot_waterfall(for_display(raw), x_axis="slant_range", gamma=0.5, ax=ax_raw, title="Raw (slant range)")
plot_waterfall(for_display(corrected), x_axis="across_track", y_axis="along_track",
               vmin_pct=2, vmax_pct=99.5, ax=ax_cor, title="Bottom track + TVG + ground range (dB)")
fig.savefig(out / "correct_a_line.png", dpi=110)
One patch through the chain#
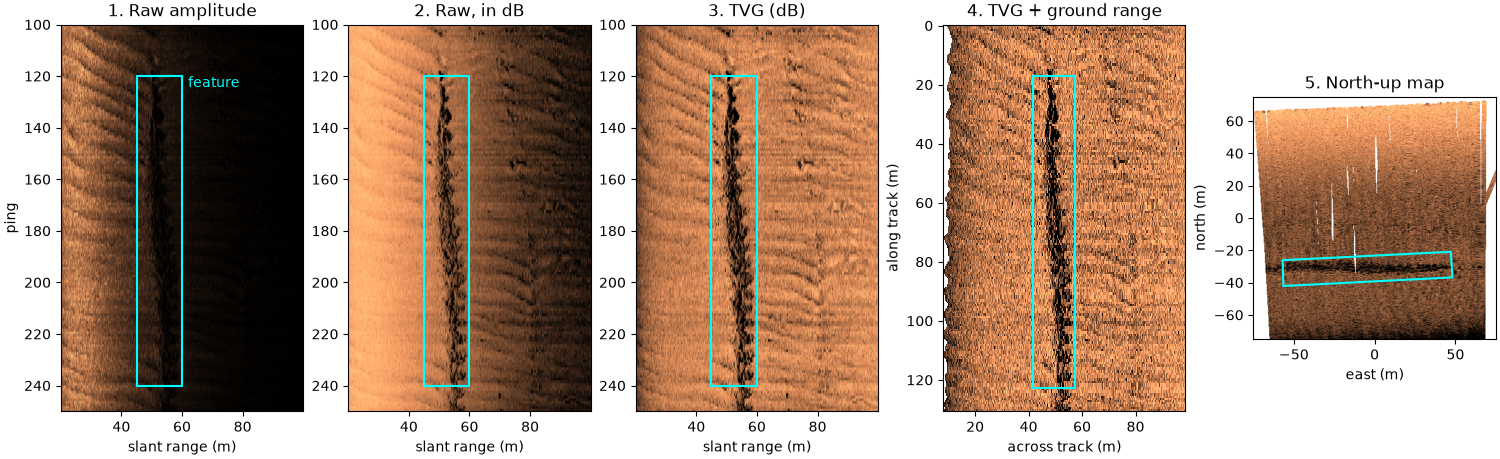
The same patch of the starboard side after each step: pings 100 to 250, 20 to 100 m of slant range, around the dark linear feature at about 52 m. The box marks the feature in every panel. The median raw amplitude falls from 157 at 25 m to 6 at 85 m, which in dB is 29 dB of steady darkening. After TVG the 25 m column is 3.4 dB darker than the 85 m one: the gain is about level now, and what is left near range is mostly the beam pattern. Ground range moves every sample inward (at ping 180, with the towfish 17.2 m above the seabed, the feature moves from 52.0 m slant range to 49.1 m across track), most near nadir, which is why the near edge of panel 4 is ragged: it follows the altitude. The north-up view places the patch on a map. The line runs west, so starboard is north and the feature runs east-west.
STARBOARD = 1
pings = slice(100, 250)
patch = corrected.isel(ping=pings, channel=STARBOARD)
step = 8  # samples averaged per displayed column, about 7 cm
amp = uncorrected_backscatter(patch).coarsen(sample=step, boundary="trim").mean().values
tvg_db = patch["backscatter_intensity"].coarsen(sample=step, boundary="trim").mean().values
slant = patch["slant_range_m"].coarsen(sample=step, boundary="trim").mean().values
across = patch["across_track_m"].coarsen(sample=step, boundary="trim").mean().values
along = along_track_distance_m(corrected)[pings]
cols = (slant[0] >= 20) & (slant[0] <= 100) & np.isfinite(across).all(axis=0)
raw_db = 20 * np.log10(np.clip(amp, 1e-6, None))


def level_at(img, metres):
    """Median of an image's column nearest a slant range."""
    return float(np.nanmedian(img[:, np.argmin(np.abs(slant[0] - metres))]))


print(f"raw amplitude, median: {level_at(amp, 25):.0f} at 25 m, {level_at(amp, 85):.0f} at 85 m slant range")
print(f"raw level: {level_at(raw_db, 25) - level_at(raw_db, 85):.1f} dB brighter at 25 m than at 85 m; "
      f"after TVG: {level_at(tvg_db, 25) - level_at(tvg_db, 85):+.1f} dB")
mid = 80  # ping 180, in the middle of the feature
k = np.argmin(np.abs(slant[mid] - 52))
print(f"ping {100 + mid}: altitude {float(patch['altitude_m'][mid]):.1f} m; the feature at "
      f"{slant[mid, k]:.1f} m slant range lies {across[mid, k]:.1f} m across track")

# The box around the feature: pings 120 to 240, 45 to 60 m slant range.
box_pings, box_slant = (20, 140), (45.0, 60.0)
box_cols = [np.argmin(np.abs(slant[0] - r)) for r in box_slant]

fig, axes = plt.subplots(1, 5, figsize=(15, 4.6), constrained_layout=True)
extent = [slant[0, cols][0], slant[0, cols][-1], pings.stop, pings.start]
views = [(amp, "1. Raw amplitude"), (raw_db, "2. Raw, in dB"), (tvg_db, "3. TVG (dB)")]
for ax, (img, title) in zip(axes, views):
    lo, hi = np.nanpercentile(img[:, cols], [2, 99.5])
    ax.imshow(img[:, cols], cmap="copper", vmin=lo, vmax=hi, aspect="auto", extent=extent)
    ax.add_patch(Rectangle((box_slant[0], pings.start + box_pings[0]), box_slant[1] - box_slant[0],
                           box_pings[1] - box_pings[0], fill=False, ec="cyan", lw=1.5))
    ax.set(title=title, xlabel="slant range (m)")
axes[0].set_ylabel("ping")
axes[0].text(box_slant[1] + 2, pings.start + box_pings[0], "feature", color="cyan", va="top")

ax = axes[3]
lo, hi = np.nanpercentile(tvg_db[:, cols], [2, 99.5])
ax.pcolormesh(across[:, cols], np.broadcast_to(along[:, None] - along[0], across[:, cols].shape), tvg_db[:, cols],
              cmap="copper", vmin=lo, vmax=hi, shading="nearest", rasterized=True)
ax.invert_yaxis()
a0, a1 = across[box_pings[0], box_cols[0]], across[box_pings[1], box_cols[1]]
ax.add_patch(Rectangle((a0, along[box_pings[0]] - along[0]), a1 - a0, along[box_pings[1]] - along[box_pings[0]],
                       fill=False, ec="cyan", lw=1.5))
ax.set(title="4. TVG + ground range", xlabel="across track (m)", ylabel="along track (m)")

# North-up: the samples gridded onto a 150 m map window at 0.375 m cells,
# by linear interpolation between them; cells more than 1.5 m from any
# sample (the pings are about 0.9 m apart) stay empty.
lat, lon = patch["latitude_per_sample"].values, patch["longitude_per_sample"].values
c_lat, c_lon = float(np.nanmean(lat[:, ::50])), float(np.nanmean(lon[:, ::50]))
window, meta = extract_georef_window(patch.expand_dims(channel=[STARBOARD]).transpose("ping", "channel", "sample"),
                                     400, resolution_m=0.375, center_lat=c_lat, center_lon=c_lon,
                                     interp_method="linear", max_search_radius_m=1.5)
grid = window.backscatter
ax = axes[4]
lo, hi = np.nanpercentile(grid, [2, 99.5])
ax.imshow(grid, cmap="copper", vmin=lo, vmax=hi, origin="lower", extent=[-75, 75, -75, 75])
corners = [(box_pings[i], step * box_cols[j] + 0) for i, j in ((0, 0), (0, 1), (1, 1), (1, 0))]
xy = [locate_point(float(lat[p, s]), float(lon[p, s]), meta) for p, s in corners]
ax.add_patch(Polygon([((c - meta["center_col"]) * 0.375, (r - meta["center_row"]) * 0.375) for r, c in xy],
                     fill=False, ec="cyan", lw=1.5))
ax.set(title="5. North-up map", xlabel="east (m)", ylabel="north (m)", facecolor="white")
fig.savefig(out / "correct_a_line_steps.png", dpi=150)
raw amplitude, median: 157 at 25 m, 6 at 85 m slant range
raw level: 29.0 dB brighter at 25 m than at 85 m; after TVG: -3.4 dB
ping 180: altitude 17.2 m; the feature at 52.0 m slant range lies 49.1 m across track
Reading the result#
The default TVG uses 30 log R spreading and Francois-Garrison
absorption. Whether a sonar already applied some gain in hardware
varies; fit_tvg_models() measures what a
dataset still needs, and check_tvg() applies
the result to check it. Pass the fit’s tvg_params to
apply_tvg() to use it
(The sonar equation and time-varying gain works through all three on
this line and two others). Target chips at several corrections and resolutions
renders catalog targets at each of these levels as image chips, the
way a training dataset sees them.
Total running time of the script: (0 minutes 43.149 seconds)