Note
Go to the end to download the full example code.
Swath tiles for annotation, and boxes back to targets#
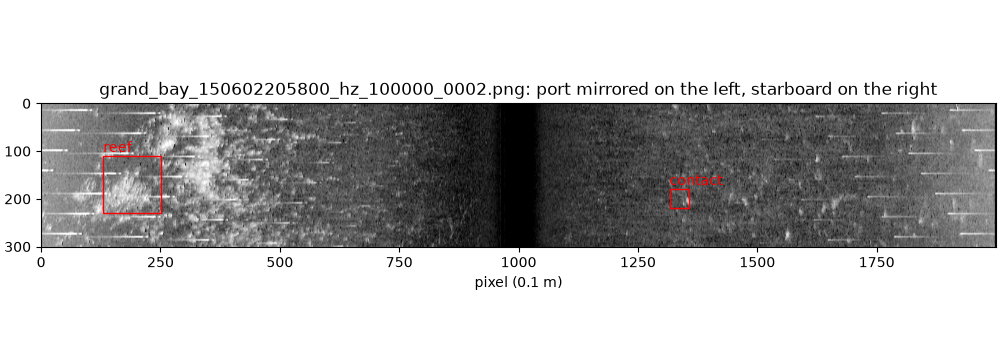
The first step of training an object detector on sidescan data is images
a person can annotate. write_swath_tiles()
cuts a corrected line into dual-swath tiles (port mirrored on the left,
starboard on the right) with square pixels in metres, writes them as
PNG, and records in tiles.json where each tile sits in the sonar data.
Boxes drawn on the tiles, by a person in an annotation tool or by a
detector, come back as targets in the sonar data with
read_coco_boxes() and
boxes_to_targets(): file, ping, side, sample
and position.
Data: USGS Grand Bay, U.S. public domain (see Example data).
Usage: python examples/gallery/plot_swath_tiles.py [output_dir]
# 2026 rshomberg@uri.edu

import json
import sys
from pathlib import Path

import matplotlib.pyplot as plt
import numpy as np
from PIL import Image

from sidescanpy import datasets
from sidescanpy.export.ml import boxes_to_targets, read_coco_boxes, write_swath_tiles
from sidescanpy.io import read_and_convert
from sidescanpy.log import configure_logging
from sidescanpy.processing import (
    apply_tvg,
    compute_geometric_ranges,
    compute_georeferencing,
    interpolate_aux_onto_pings,
)

out = Path(sys.argv[1]) if len(sys.argv) > 1 else Path(".")
out.mkdir(parents=True, exist_ok=True)
configure_logging("WARNING")
Convert and correct. Georeferencing is only needed to give the targets a latitude and longitude at the end; the tiles themselves are cut from the native ping x sample grid.
Navigation in this file is sample-and-hold, and each GPS update is logged
over two entries (the jump, then a tiny follow-up one entry later).
merge_window_s joins the two into one update; without it every
update becomes two fixes 65 ms apart and the interpolated track stalls
for one ping in seven. aux_update_events()
shows the pattern (changes 1 entry apart, then 6 to 7).
survey = read_and_convert([datasets.fetch("usgs_grand_bay_150602205800.xtf")], fmt="xtf")
survey = interpolate_aux_onto_pings(survey, merge_window_s=0.3)
survey = apply_tvg(survey)
survey = compute_geometric_ranges(survey)
survey = compute_georeferencing(survey)
ds = survey.get_frequency("hz_100000").dataset
21:14:18 WARNING sidescanpy.processing.aux_fixes: held_value_fixes ['heading_deg']: 4 update events combine more than 5 changes; the stream may update faster than merge_window_s=0.3 s
21:14:18 WARNING sidescanpy.processing.aux_fixes: held_value_fixes ['heading_deg']: 4 update events combine more than 5 changes; the stream may update faster than merge_window_s=0.3 s
21:14:18 WARNING sidescanpy.processing.aux_fixes: held_value_fixes ['pitch_deg']: 4 update events combine more than 5 changes; the stream may update faster than merge_window_s=0.3 s
21:14:18 WARNING sidescanpy.processing.aux_fixes: held_value_fixes ['roll_deg']: 2 update events combine more than 5 changes; the stream may update faster than merge_window_s=0.3 s
Tiles 30 m along track with 0.1 m pixels, overlapping by 5 m so an object on a tile edge appears whole in one of them. Each line and frequency adds its tiles to the same folder and index. The 8-bit stretch runs from the 5th to the 99.7th percentile of each tile, so the dark water column under the towfish does not wash out the seabed.
tiles_dir = out / "tiles"
records = write_swath_tiles(ds, tiles_dir, ss_h5="grand_bay_150602205800", freq_key="hz_100000",
                            tile_m=30.0, px_m=0.1, overlap_m=5.0, pct_low=5, pct_high=99.7)
print(f"{len(records)} tiles, {records[0].window.width} x {records[0].window.height} px")
print(json.dumps(json.loads((tiles_dir / "tiles.json").read_text())[records[2].file_name])[:200], "...")
4 tiles, 2000 x 301 px
{"ss_h5": "grand_bay_150602205800", "freq_key": "hz_100000", "window": {"layout": "dual", "channel": null, "ping_start": 156, "ping_stop": 249, "sample_start": 0, "sample_stop": 4096, "px_per_ping": 3 ...
Annotate the tiles. Any tool that exports COCO works. With FiftyOne and its CVAT annotation backend, for example (not run here: it needs FiftyOne, a CVAT account and a person drawing boxes):
import fiftyone as fo

tiles = fo.Dataset.from_dir(dataset_dir="tiles", dataset_type=fo.types.ImageDirectory)
tiles.annotate("boxes", backend="cvat", label_field="ground_truth",
               label_type="detections", classes=["contact", "reef"], launch_editor=True)
# ... draw boxes in CVAT, save, then:
tiles.load_annotations("boxes")
tiles.export(export_dir="annotations", label_field="ground_truth",
             dataset_type=fo.types.COCODetectionDataset)
Here a small COCO file stands in for that export: one box on each of two objects in the third tile.
record = records[2]
w = record.window
x1, y1 = w.to_pixel(217.5, 1376.5, 1)   # a bright return on starboard
x2, y2 = w.to_pixel(208.5, 3317.5, 0)   # a reef-like patch on port
coco = {
    "images": [{"id": 1, "file_name": f"data/{record.file_name}", "width": w.width, "height": w.height}],
    "categories": [{"id": 1, "name": "contact"}, {"id": 2, "name": "reef"}],
    "annotations": [
        {"id": 1, "image_id": 1, "category_id": 1, "bbox": [x1 - 20, y1 - 20, 40, 40]},
        {"id": 2, "image_id": 1, "category_id": 2, "bbox": [x2 - 60, y2 - 60, 120, 120]},
    ],
}
(out / "annotations").mkdir(exist_ok=True)
(out / "annotations" / "labels.json").write_text(json.dumps(coco))
405
Read the boxes back and turn them into targets. Each target records the
.ss.h5 file and ping it came from, so it can be rendered as chips
straight away (see Target chips at several corrections and resolutions) or
scored against a catalog with match_targets().
boxes = read_coco_boxes(out / "annotations" / "labels.json")
targets = boxes_to_targets(ds, record, boxes[record.file_name], source_format="annotation")
for t in targets:
    side = "starboard" if t.channel == 1 else "port"
    print(f"{t.target_id}: {t.category:8s} ping {t.ping}, {side}, sample {t.sample}, "
          f"lat {t.latitude:.6f} lon {t.longitude:.6f}, "
          f"{t.extra_attributes['width_m']:.1f} x {t.extra_attributes['length_m']:.1f} m")

fig, ax = plt.subplots(figsize=(10, 3.5), constrained_layout=True)
ax.imshow(Image.open(tiles_dir / record.file_name), cmap="gray")
for box, t in zip(boxes[record.file_name], targets):
    ax.add_patch(plt.Rectangle((box.x, box.y), box.w, box.h, fill=False, edgecolor="red"))
    ax.text(box.x, box.y - 8, t.category, color="red")
ax.set_title(f"{record.file_name}: port mirrored on the left, starboard on the right")
ax.set_xlabel("pixel (0.1 m)")
fig.savefig(out / "swath_tiles.png", dpi=150)
grand_bay_150602205800_hz_100000_0002_000: contact  ping 217, starboard, sample 1376, lat 30.363818 lon -88.360445, 4.0 x 4.0 m
grand_bay_150602205800_hz_100000_0002_001: reef     ping 208, port, sample 3317, lat 30.362860 lon -88.360015, 12.0 x 12.0 m
Total running time of the script: (0 minutes 1.711 seconds)