Note
Go to the end to download the full example code.
What’s in a file: metadata and aux streams#
Before correcting anything, find out what a recording holds: which
frequencies, at what sample rate and range, which per-ping fields are
real and which are empty, and how often each sensor actually reported.
Everything here is plain xarray on the converted survey, plus
aux_update_events() for the update rates.
The line is an EdgeTech JSF recording with the usual set of auxiliary streams: GPS, attitude, pressure (depth) and an (empty) DVL record.
Data: JNCC Wight-Barfleur Reef, Open Government Licence v3.0 (see Example data).
Usage: python examples/gallery/plot_whats_in_a_file.py [output_dir]
# 2026 rshomberg@uri.edu

import sys
from pathlib import Path

import matplotlib.pyplot as plt
import numpy as np

from sidescanpy import datasets
from sidescanpy.io import read_and_convert
from sidescanpy.log import configure_logging
from sidescanpy.processing import aux_update_events

out = Path(sys.argv[1]) if len(sys.argv) > 1 else Path(".")
out.mkdir(parents=True, exist_ok=True)
configure_logging("WARNING")

survey = read_and_convert([datasets.fetch("jncc_wight_barfleur_20130321174522.jsf")], fmt="jsf")
print(survey)
21:09:53 WARNING sidescanpy.io.jsf.reader: jncc_wight_barfleur_20130321174522.jsf: skipped 910 message(s) of unsupported type(s) (type: count) 2000: 910
21:09:53 WARNING sidescanpy.io.jsf.converter: 1 incomplete ping(s) detected; repair_mode='nan_pad'
SideScanSurvey(name='jncc_wight_barfleur_20130321174522', n_frequencies=2, nav=88, att=764, dvl=0, sensors=1)
The frequencies#
One dataset per frequency, each with its own ping axis. The sample interval follows from the sample rate and the sound speed (1500 m/s here: this file records none), and the range from the number of samples.
def seconds(t):
    return (t - t[0]).astype("timedelta64[ns]").astype(np.int64) / 1e9


for freq_key in survey.frequencies:
    ds = survey.get_frequency(freq_key).dataset
    t = seconds(ds["time"].values)
    sound = float(np.nanmedian(ds["sound_vel_ms"].values)) or 1500.0
    sample_m = (sound if sound > 0 else 1500.0) / (2 * ds.attrs["sample_rate_hz"])
    print(f"{freq_key}: {ds.sizes['ping']} pings over {t[-1]:.0f} s ({1 / np.median(np.diff(t)):.1f} pings/s), "
          f"{ds.sizes['sample']} samples of {100 * sample_m:.2f} cm = {ds.sizes['sample'] * sample_m:.0f} m range, "
          f"chirp {ds.attrs['freq_hz_start'] / 1e3:.0f}-{ds.attrs['freq_hz_end'] / 1e3:.0f} kHz, "
          f"pulse {ds.attrs['pulse_length_us'] / 1e3:.0f} ms")
hz_218740: 287 pings over 80 s (3.6 pings/s), 11568 samples of 1.73 cm = 200 m range, chirp 219-242 kHz, pulse 8 ms
hz_521000: 288 pings over 81 s (3.6 pings/s), 23140 samples of 0.86 cm = 200 m range, chirp 521-574 kHz, pulse 5 ms
The per-ping fields#
Every ping carries its own copy of the navigation and attitude. Check which fields hold data before trusting them: a field that is constant, zero or NaN was not recorded. Here altitude and sound speed are 0, so the corrections will need the bottom track and the 1500 m/s default.
ds = survey.get_frequency("hz_521000").dataset
print(f"{'field':22s} {'finite':>7s} {'distinct':>9s} {'min':>12s} {'max':>12s}")
for name in ds.data_vars:
    v = ds[name]
    if v.dims != ("ping",) or not np.issubdtype(v.dtype, np.number):
        continue
    x = v.values.astype(float)
    ok = np.isfinite(x)
    lo, hi = (np.nanmin(x), np.nanmax(x)) if ok.any() else (np.nan, np.nan)
    print(f"{name:22s} {ok.mean():7.0%} {len(np.unique(x[ok])):9d} {lo:12.6g} {hi:12.6g}")
field                   finite  distinct          min          max
latitude                  100%        21      50.3576      50.3577
longitude                 100%        33     -1.13551       -1.132
heading_deg               100%        96       263.59          296
depth_m                   100%        96       32.003       32.503
roll_deg                  100%        32     -1.79077      1.49963
pitch_deg                 100%        38     -5.59204     -1.09314
heave_m                     0%         0          nan          nan
altitude_m                100%         1            0            0
sound_vel_ms              100%         1            0            0
fathometer_reading_m      100%         1            0            0
layback_m                 100%        96      125.871      125.999
cable_out_m               100%         1          130          130
The aux streams and how often they update#
The recorder logs each sensor as it arrives, but most sensors are
sample-and-hold: an entry often repeats the last value.
aux_update_events() counts the real changes,
which is the rate that matters for interpolating onto pings.
for name in ("navigation", "attitude", "dvl"):
    record = getattr(survey, name)
    if record is None or record.sizes.get("obs", 0) == 0:
        print(f"{name}: empty")
        continue
    t = seconds(record["time"].values)
    print(f"{name}: {record.sizes['obs']} entries over {t[-1]:.0f} s")
    for var, stats in aux_update_events(record).items():
        gap = stats.change_gap_s["p50"]
        print(f"    {var:12s} {stats.changes:4d} changes, typically every {gap:.2f} s")
for name, record in survey.sensors.items():
    print(f"sensor {name}: {record.sizes['obs']} entries, variables {list(record.data_vars)}")
navigation: 88 entries over 79 s
    latitude       74 changes, typically every 1.00 s
    longitude      79 changes, typically every 1.00 s
attitude: 764 entries over 81 s
    roll_deg      547 changes, typically every 0.11 s
    pitch_deg     600 changes, typically every 0.11 s
    heave_m         0 changes, typically every nan s
    heading_deg   738 changes, typically every 0.11 s
dvl: empty
sensor pressure: 624 entries, variables ['depth_m']
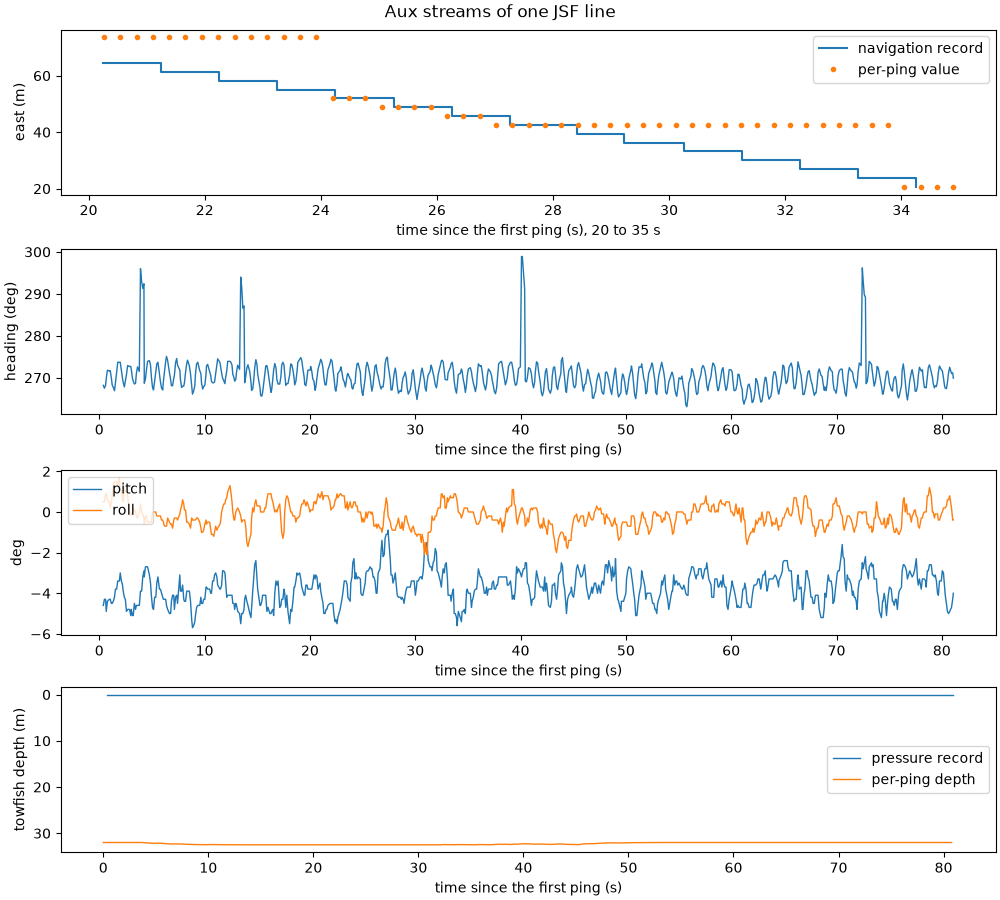
Plotting the streams over time turns these numbers into findings:
Navigation is held, and the per-ping copy is staler. The navigation record changes about once a second and holds its value in between. The per-ping copy usually follows it, but on this line it sometimes holds one position for up to 7 s and then jumps up to 22 m. Use the navigation record, interpolated between its real fixes, not the per-ping positions (
interpolate_aux_onto_pings()does).The compass glitches. Heading jumps by about 25 degrees for a fraction of a second four times; real turns are not that fast. Those pings would be rotated wrongly when georeferenced.
The pressure sensor writes zeros. The pressure record is 0 m throughout, while the per-ping depth reads 32 m: the device did not populate the pressure message (a known quirk of some JSF recorders), and the per-ping value is the one to use.
nav, att, depth = survey.navigation, survey.attitude, survey.sensors["pressure"]
t0 = ds["time"].values[0]
rel = lambda t: (t - t0).astype("timedelta64[ns]").astype(np.int64) / 1e9  # noqa: E731
lon0, k = float(np.nanmean(nav["longitude"])), 111_320 * np.cos(np.radians(float(np.nanmean(nav["latitude"]))))
fig, axes = plt.subplots(4, 1, figsize=(10, 9), constrained_layout=True)
zoom = (20.0, 35.0)
nt, pt = rel(nav["time"].values), rel(ds["time"].values)
nsel, psel = (nt >= zoom[0]) & (nt <= zoom[1]), (pt >= zoom[0]) & (pt <= zoom[1])
axes[0].step(nt[nsel], (nav["longitude"].values[nsel] - lon0) * k, where="post", label="navigation record")
axes[0].plot(pt[psel], (ds["longitude"].values[psel] - lon0) * k, "o", ms=3, label="per-ping value")
axes[0].set_ylabel("east (m)")
axes[0].set_xlabel(f"time since the first ping (s), {zoom[0]:.0f} to {zoom[1]:.0f} s")
axes[0].legend(loc="upper right")
axes[1].plot(rel(att["time"].values), att["heading_deg"].values, lw=1)
axes[1].set_ylabel("heading (deg)")
axes[2].plot(rel(att["time"].values), att["pitch_deg"].values, lw=1, label="pitch")
axes[2].plot(rel(att["time"].values), att["roll_deg"].values, lw=1, label="roll")
axes[2].set_ylabel("deg")
axes[2].legend(loc="upper left")
axes[3].plot(rel(depth["time"].values), depth["depth_m"].values, lw=1, label="pressure record")
axes[3].plot(pt, ds["depth_m"].values, lw=1, label="per-ping depth")
axes[3].set_ylabel("towfish depth (m)")
axes[3].invert_yaxis()
axes[3].legend(loc="center right")
for ax in axes[1:]:
    ax.set_xlabel("time since the first ping (s)")
fig.suptitle("Aux streams of one JSF line")
fig.savefig(out / "whats_in_a_file.png", dpi=150)
Total running time of the script: (0 minutes 0.888 seconds)