Note
Go to the end to download the full example code.
Read a file#
Convert one raw EdgeTech JSF line to sidescanpy’s data model, save it as
.ss.h5, and look at it. read_and_convert() reads JSF,
Klein SDF and XTF into the same structure: a
SideScanSurvey holding one xarray.Dataset
per frequency, with backscatter shaped (ping, channel, sample)
(channel 0 is port, 1 starboard) plus the navigation and attitude
records.
Data: JNCC Wight-Barfleur Reef, Open Government Licence v3.0 (see Example data).
Usage: python examples/gallery/plot_read_a_file.py [output_dir]
# 2026 rshomberg@uri.edu

import sys
from pathlib import Path

import matplotlib.pyplot as plt

from sidescanpy import datasets
from sidescanpy.io import read_and_convert
from sidescanpy.io.hdf5 import write_survey
from sidescanpy.log import configure_logging
from sidescanpy.processing import compute_geometric_ranges
from sidescanpy.viz import plot_waterfall

out = Path(sys.argv[1]) if len(sys.argv) > 1 else Path(".")
out.mkdir(parents=True, exist_ok=True)
configure_logging("INFO")
Download (once) and convert. The reader logs two warnings worth knowing about: this file records no sound velocity (1500 m/s is used) and no altitude. Correct a line fills the altitude in.
21:09:27 WARNING sidescanpy.io.jsf.reader: jncc_wight_barfleur_20130321174522.jsf: skipped 910 message(s) of unsupported type(s) (type: count) 2000: 910
21:09:27 WARNING sidescanpy.io.jsf.converter: 1 incomplete ping(s) detected; repair_mode='nan_pad'
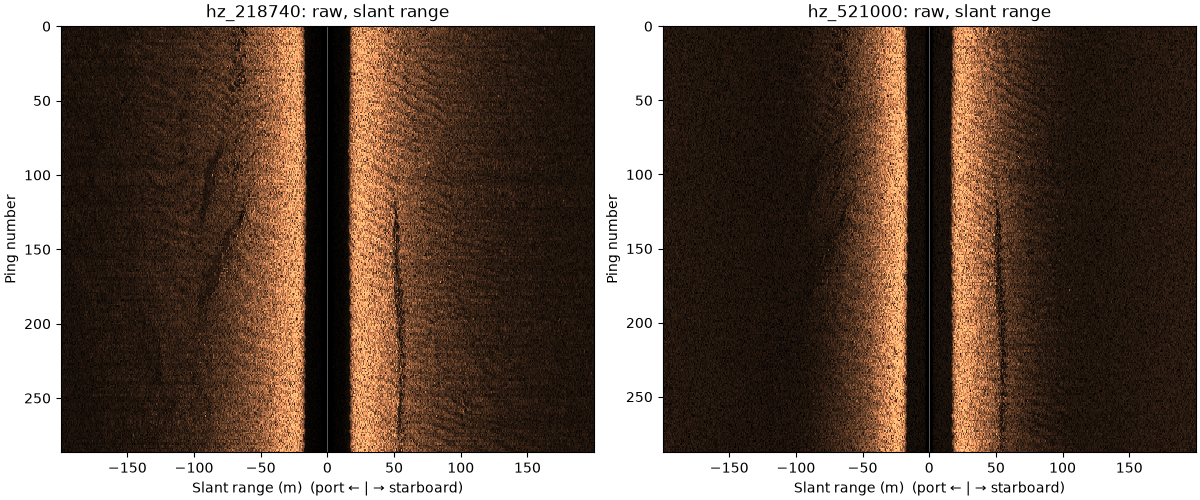
One xarray Dataset per frequency: backscatter is (ping, channel, sample), channel 0 = port, 1 = starboard.
hz_218740 {'ping': 287, 'channel': 2, 'sample': 11568}
hz_521000 {'ping': 288, 'channel': 2, 'sample': 23140}
The two frequencies of the same pings, raw amplitude against slant range. The dark band in the middle is the water column under the towfish; the seabed starts where it ends, about 18 m out on each side. A linear seabed feature runs along the starboard side at about 50 m.
fig, axes = plt.subplots(1, 2, figsize=(12, 5), constrained_layout=True)
for ax, freq_key in zip(axes, sorted(survey.frequencies)):
    ds = compute_geometric_ranges(survey.get_frequency(freq_key).dataset)
    plot_waterfall(ds, x_axis="slant_range", gamma=0.5, ax=ax,
                   title=f"{freq_key}: raw, slant range")
fig.savefig(out / "read_a_file.png", dpi=110)
21:09:29 WARNING sidescanpy.processing.sample_axis: 287 of 287 pings have invalid sound_vel_ms (NaN or non-positive); falling back to 1500.0 m/s
21:09:29 WARNING sidescanpy.processing.geometric: 0 of 287 pings have NaN altitude_m (their ground range is NaN) and 287 have altitude_m <= 0 (ground range = slant range); the 'bottom_track' step can fill them from the first bottom return
21:09:30 WARNING sidescanpy.processing.sample_axis: 288 of 288 pings have invalid sound_vel_ms (NaN or non-positive); falling back to 1500.0 m/s
21:09:30 WARNING sidescanpy.processing.geometric: 0 of 288 pings have NaN altitude_m (their ground range is NaN) and 288 have altitude_m <= 0 (ground range = slant range); the 'bottom_track' step can fill them from the first bottom return
Total running time of the script: (0 minutes 27.402 seconds)