Note
Go to the end to download the full example code.
A wreck’s height from its shadow#
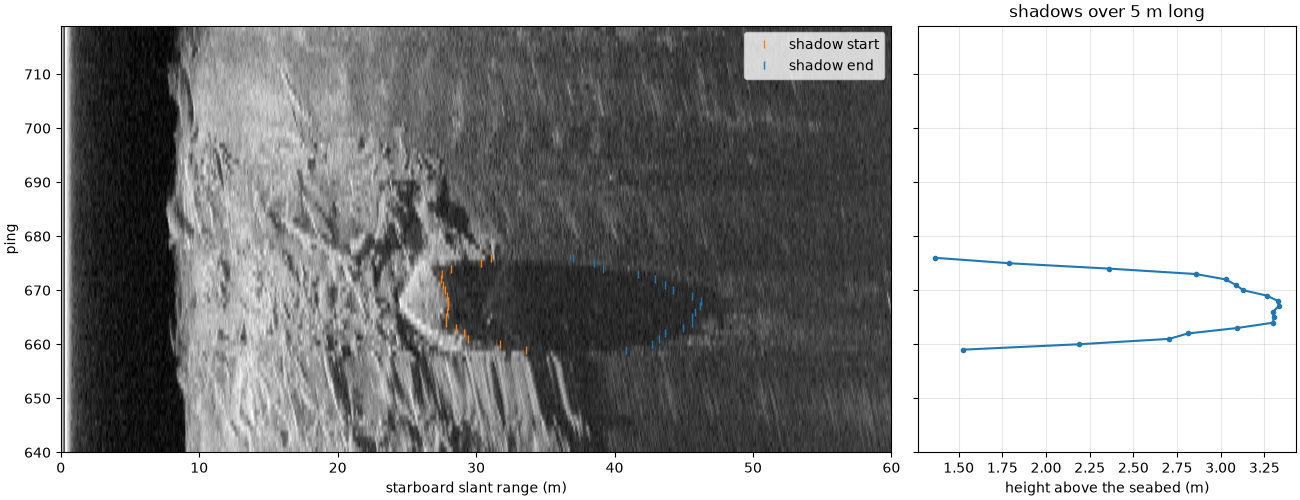
Anything standing on the seabed blocks the sound behind it, so the image
has a dark shadow beyond the object. The longer the shadow, the taller
the object. Over a flat seabed, with the towfish at altitude A and
the shadow starting at slant range R and running Ls further,
similar triangles give the height of the object’s top:
This page measures the shadow of one part of a wreck ping by ping, with
plain numpy on a corrected dataset. For many small objects (boulders,
debris, mines) detect_shadow_proposals() does
the same per region and returns a table; its defaults are tuned for
objects under 3 m high and 8 m long, so a wreck’s shadow is split into
many small pieces.
Data: BGS London Gateway, Klein 3000 at 400 kHz, Open Government Licence v3.0, contains data supplied by UKRI (see Example data).
Usage: python examples/theory/plot_shadow_height.py [output_dir]
# 2026 rshomberg@uri.edu

import sys
from pathlib import Path

import matplotlib.pyplot as plt
import numpy as np
from matplotlib.patches import Polygon, Rectangle
from scipy.ndimage import binary_closing, uniform_filter1d

from sidescanpy import datasets
from sidescanpy.export.windows.levels import with_db_var
from sidescanpy.io import read_and_convert
from sidescanpy.log import configure_logging
from sidescanpy.processing import altitude_from_bottom_track, compute_geometric_ranges

out = Path(sys.argv[1]) if len(sys.argv) > 1 else Path(".")
out.mkdir(parents=True, exist_ok=True)
configure_logging("ERROR")
The line and the wreck#
One pass over the Dynamo wreck, starboard side. The recorder applied its own gain, so the samples are only converted to dB. Altitude comes from the file, with the bottom track filling any ping without it.
survey = read_and_convert([datasets.fetch("bgs_london_gateway_dynamo_88.xtf")], fmt="xtf", nav_crs="EPSG:32631")
ds = survey.get_frequency("hz_400000").dataset.load()
ds = with_db_var(compute_geometric_ranges(altitude_from_bottom_track(ds)))
STARBOARD = 1
level = ds["backscatter_db"].values[:, STARBOARD]
slant = ds["slant_range_m"].values[0, STARBOARD]
altitude = ds["altitude_m"].values
pings = slice(640, 720)
print(f"altitude over the wreck: {np.median(altitude[pings]):.1f} m; samples every {100 * slant[1]:.0f} cm")
altitude over the wreck: 8.6 m; samples every 3 cm
What counts as shadow#
The seabed level falls with range, so a shadow is judged against the median level at the same range over the whole line. The samples are averaged over 1 m of range and 5 pings first, which keeps speckle from breaking the shadow up. A shadow is then the longest run at least 3 dB below that level beyond the first bottom return, with gaps under 0.5 m closed. 3 dB is low because the far part of this shadow sits close to the noise floor: past about 45 m the seabed itself is barely above it.
sample_m = float(slant[1] - slant[0])
smooth = uniform_filter1d(uniform_filter1d(level, int(round(1.0 / sample_m)), axis=1), 5, axis=0)
background = np.median(smooth, axis=0)


def shadow_run(ping):
    """Slant range (m) where the longest shadow run starts and its length (m)."""
    below = (smooth[ping] < background - 3.0) & (slant > altitude[ping] + 2.0) & (slant < 60.0)
    below = binary_closing(below, np.ones(int(round(0.5 / sample_m))))
    edges = np.diff(np.concatenate([[0], below.astype(int), [0]]))
    starts, stops = np.flatnonzero(edges == 1), np.flatnonzero(edges == -1)
    if starts.size == 0:
        return np.nan, 0.0
    k = int(np.argmax(stops - starts))
    return float(slant[starts[k]]), float(slant[stops[k] - 1] - slant[starts[k]])


ping_index = np.arange(ds.sizes["ping"])[pings]
runs = np.array([shadow_run(p) for p in ping_index])
start_m, length_m = runs[:, 0], runs[:, 1]
height_m = altitude[pings] * length_m / (start_m + length_m)
tallest = int(np.nanargmax(height_m))
shown = length_m > 5.0
a_t, r_t, l_t = altitude[ping_index[tallest]], start_m[tallest], length_m[tallest]
print(f"longest shadow at ping {ping_index[tallest]}: starts at {r_t:.1f} m slant range, "
      f"{l_t:.1f} m long -> top {height_m[tallest]:.1f} m above the seabed")
print(f"   altitude there {a_t:.2f} m: h = {a_t:.2f} x {l_t:.1f} / ({r_t:.1f} + {l_t:.1f}) = "
      f"{a_t * l_t / (r_t + l_t):.2f} m; ground range to the shadow start sqrt({r_t:.1f}^2 - {a_t:.2f}^2) = "
      f"{np.sqrt(r_t ** 2 - a_t ** 2):.1f} m, to its end {np.sqrt((r_t + l_t) ** 2 - a_t ** 2):.1f} m")
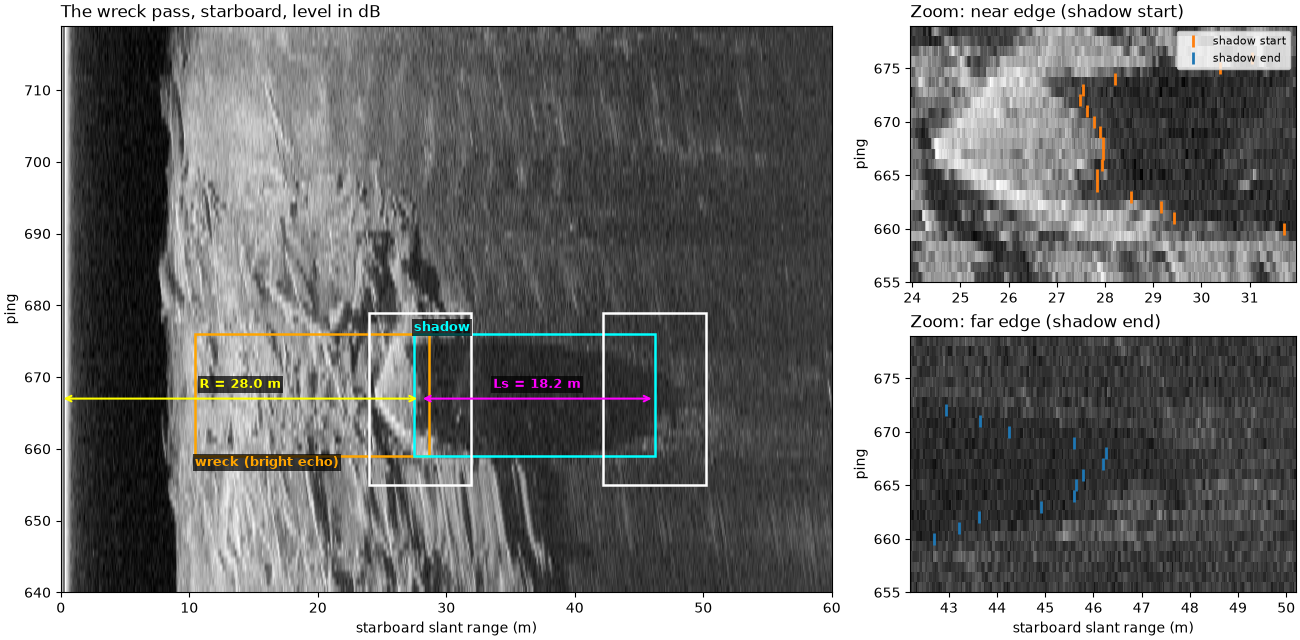
longest shadow at ping 667: starts at 28.0 m slant range, 18.2 m long -> top 3.3 m above the seabed
   altitude there 8.44 m: h = 8.44 x 18.2 / (28.0 + 18.2) = 3.33 m; ground range to the shadow start sqrt(28.0^2 - 8.44^2) = 26.7 m, to its end 45.4 m
The figure shows the wreck pass with what the rule finds boxed: the wreck’s bright echo (samples at least 6 dB above the line’s median at the same range, just before each shadow), the shadow, and, on the ping with the longest shadow, the two ranges the formula uses. The zooms on the right show the shadow’s near and far edges on that ping and its neighbors; the far edge is the softer one, where the seabed beyond is close to the noise.
bright = np.zeros(len(ping_index), bool)
wreck_lo, wreck_hi = [], []
for i, p in enumerate(ping_index):
    if not shown[i]:
        continue
    sel = (slant > altitude[p] + 2.0) & (slant < start_m[i]) & (smooth[p] > background + 6.0)
    if sel.any():
        bright[i] = True
        wreck_lo.append(slant[sel].min())
        wreck_hi.append(slant[sel].max())
crop = level[pings, : int(60.0 / sample_m)]
lo, hi = np.nanpercentile(crop, [1, 99.7])
p_shown = ping_index[shown]
fig = plt.figure(figsize=(13, 6.4), constrained_layout=True)
grid = fig.add_gridspec(2, 2, width_ratios=[2, 1])
ax_img = fig.add_subplot(grid[:, 0])
ax_z1, ax_z2 = fig.add_subplot(grid[0, 1]), fig.add_subplot(grid[1, 1])
ax_img.imshow(crop, cmap="gray", vmin=lo, vmax=hi, origin="lower", aspect="auto",
              extent=[0, 60.0, ping_index[0], ping_index[-1]])


def label_box(ax, x0, x1, y0, y1, text, colour, where="above"):
    ax.add_patch(Rectangle((x0, y0), x1 - x0, y1 - y0, fill=False, ec=colour, lw=1.8))
    ax.text(x0, y1 if where == "above" else y0, text, color=colour, fontsize=9, fontweight="bold",
            va="bottom" if where == "above" else "top",
            bbox=dict(boxstyle="square,pad=0.15", fc="black", ec="none", alpha=0.7))


label_box(ax_img, np.percentile(wreck_lo, 10), np.percentile(wreck_hi, 90), p_shown.min(), p_shown.max(),
          "wreck (bright echo)", "orange", where="below")
label_box(ax_img, np.nanmin(start_m[shown]), np.nanmax((start_m + length_m)[shown]), p_shown.min(),
          p_shown.max(), "shadow", "cyan")
pt = ping_index[tallest]
ax_img.annotate("", (r_t, pt), (0, pt), arrowprops=dict(arrowstyle="<->", color="yellow", lw=1.5))
ax_img.annotate("", (r_t + l_t, pt), (r_t, pt), arrowprops=dict(arrowstyle="<->", color="magenta", lw=1.5))
for x, text, colour in ((r_t / 2, f"R = {r_t:.1f} m", "yellow"), (r_t + l_t / 2, f"Ls = {l_t:.1f} m", "magenta")):
    ax_img.text(x, pt + 1.5, text, color=colour, fontsize=9, ha="center", fontweight="bold",
                bbox=dict(boxstyle="square,pad=0.15", fc="black", ec="none", alpha=0.7))
Z = 4.0
for ax_z, edge, name in ((ax_z1, r_t, "near edge (shadow start)"), (ax_z2, r_t + l_t, "far edge (shadow end)")):
    label_box(ax_img, edge - Z, edge + Z, pt - 12, pt + 12, "", "w")
    ax_z.imshow(level[pt - 12: pt + 13], cmap="gray", vmin=lo, vmax=hi, origin="lower", aspect="auto",
                extent=[0, slant[-1], pt - 12, pt + 12], interpolation="nearest")
    ax_z.plot(start_m[shown], p_shown, "|", color="C1", ms=8, mew=2, label="shadow start")
    ax_z.plot((start_m + length_m)[shown], p_shown, "|", color="C0", ms=8, mew=2, label="shadow end")
    ax_z.set_xlim(edge - Z, edge + Z)
    ax_z.set_ylim(pt - 12, pt + 12)
    ax_z.set_title(f"Zoom: {name}", loc="left")
    ax_z.set_ylabel("ping")
ax_z1.legend(loc="upper right", fontsize=8)
ax_z2.set_xlabel("starboard slant range (m)")
ax_img.set_xlabel("starboard slant range (m)")
ax_img.set_ylabel("ping")
ax_img.set_title("The wreck pass, starboard, level in dB", loc="left")
fig.savefig(out / "shadow_height_labelled.png", dpi=150)
Similar triangles#
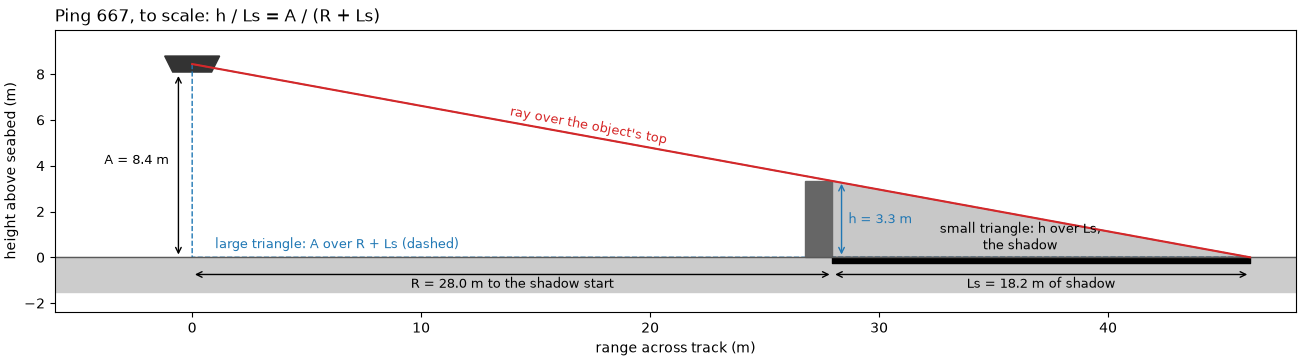
The sound that just grazes the object’s top reaches the seabed again
at the far end of the shadow. The towfish, the object’s top and the
shadow’s end lie on one straight line, so the small triangle (object
height h over the shadow length Ls) and the large one
(altitude A over the whole range R + Ls) have the same shape:
h / Ls = A / (R + Ls). The figure draws it to scale with the
numbers measured above for the longest shadow. The formula treats
R and Ls as distances across the seabed but is given the slant
ranges; at ranges several times the altitude the two differ little
(printed above: 26.7 m against 28.0 m to the shadow start).
def draw_triangles(ax, A, R, Ls):
    """Towfish at altitude A, object top at range R, shadow to R + Ls, to scale."""
    h = A * Ls / (R + Ls)
    ax.axhspan(-1.5, 0, color="0.8")
    ax.axhline(0, color="0.35", lw=1)
    ax.add_patch(Polygon([[-1.2, A + 0.35], [1.2, A + 0.35], [0.85, A - 0.35], [-0.85, A - 0.35]], color="0.2"))
    ax.add_patch(Polygon([[0, A], [0, 0], [R + Ls, 0]], fill=False, ec="C0", lw=1, ls="--"))
    ax.add_patch(Polygon([[R, h], [R, 0], [R + Ls, 0]], color="0.15", alpha=0.25, lw=0))
    ax.add_patch(Rectangle((R - 1.2, 0), 1.2, h, color="0.4"))
    ax.plot([0, R + Ls], [A, 0], color="C3", lw=1.5)
    ax.fill_between([R, R + Ls], -0.25, 0.0, color="k")
    ax.annotate("", (-0.6, 0), (-0.6, A - 0.4), arrowprops=dict(arrowstyle="<->", color="k"))
    ax.text(-1.0, A / 2, f"A = {A:.1f} m", ha="right", va="center", fontsize=9)
    ax.annotate("", (R + 0.4, 0), (R + 0.4, h), arrowprops=dict(arrowstyle="<->", color="C0"))
    ax.text(R + 0.7, h / 2, f"h = {h:.1f} m", color="C0", fontsize=9, va="center")
    ax.annotate("", (0, -0.75), (R, -0.75), arrowprops=dict(arrowstyle="<->", color="k"))
    ax.text(R / 2, -0.85, f"R = {R:.1f} m to the shadow start", ha="center", va="top", fontsize=9)
    ax.annotate("", (R, -0.75), (R + Ls, -0.75), arrowprops=dict(arrowstyle="<->", color="k"))
    ax.text(R + Ls / 2, -0.85, f"Ls = {Ls:.1f} m of shadow", ha="center", va="top", fontsize=9)
    x_lab = 0.3 * (R + Ls)
    ax.text(x_lab, A * (1 - x_lab / (R + Ls)) + 0.3, "ray over the object's top", color="C3", fontsize=9,
            rotation=-np.degrees(np.arctan2(A, R + Ls)), rotation_mode="anchor", transform_rotates_text=True)
    ax.text(1.0, 0.4, "large triangle: A over R + Ls (dashed)", color="C0", fontsize=9)
    ax.text(R + Ls * 0.45, 0.35, "small triangle: h over Ls,\nthe shadow", fontsize=9, ha="center")
    ax.set_xlim(-6, R + Ls + 2)
    ax.set_ylim(-2.4, A + 1.5)
    ax.set_aspect("equal")
    ax.set_xlabel("range across track (m)")
    ax.set_ylabel("height above seabed (m)")


fig, ax_tri = plt.subplots(figsize=(13, 3.6), constrained_layout=True)
draw_triangles(ax_tri, a_t, r_t, l_t)
ax_tri.set_title(f"Ping {ping_index[tallest]}, to scale: h / Ls = A / (R + Ls)", loc="left")
fig.savefig(out / "shadow_height_triangles.png", dpi=150)
Height ping by ping#
fig, (ax_img, ax_h) = plt.subplots(1, 2, figsize=(13, 5), width_ratios=[2.2, 1], sharey=True,
                                   constrained_layout=True)
ax_img.imshow(crop, cmap="gray", vmin=lo, vmax=hi, origin="lower", aspect="auto",
              extent=[0, 60.0, ping_index[0], ping_index[-1]])
ax_img.plot(start_m[shown], ping_index[shown], "|", color="C1", ms=6, label="shadow start")
ax_img.plot((start_m + length_m)[shown], ping_index[shown], "|", color="C0", ms=6, label="shadow end")
ax_img.set_xlabel("starboard slant range (m)")
ax_img.set_ylabel("ping")
ax_img.legend(loc="upper right")
ax_h.plot(np.where(shown, height_m, np.nan), ping_index, "o-", ms=3)
ax_h.set_xlabel("height above the seabed (m)")
ax_h.set_title("shadows over 5 m long")
ax_h.grid(alpha=0.3)
fig.savefig(out / "shadow_height.png", dpi=200)
How far to trust it#
The longest shadows put the top of this part of the wreck about 3.3 m above the seabed, and the shorter ones either side trace its rounded outline. The formula assumes a flat seabed between the object and the shadow’s end, and an end that is real: where the seabed beyond the shadow is close to the noise floor, the shadow merges into it and reads too long. A shadow also gives the height of the object’s highest point along each ping, not its shape. Compare passes from other directions (Four passes over one wreck: native and north-up) before trusting one number.
Total running time of the script: (0 minutes 3.702 seconds)