Note
Go to the end to download the full example code.
Common sidescan artifacts#
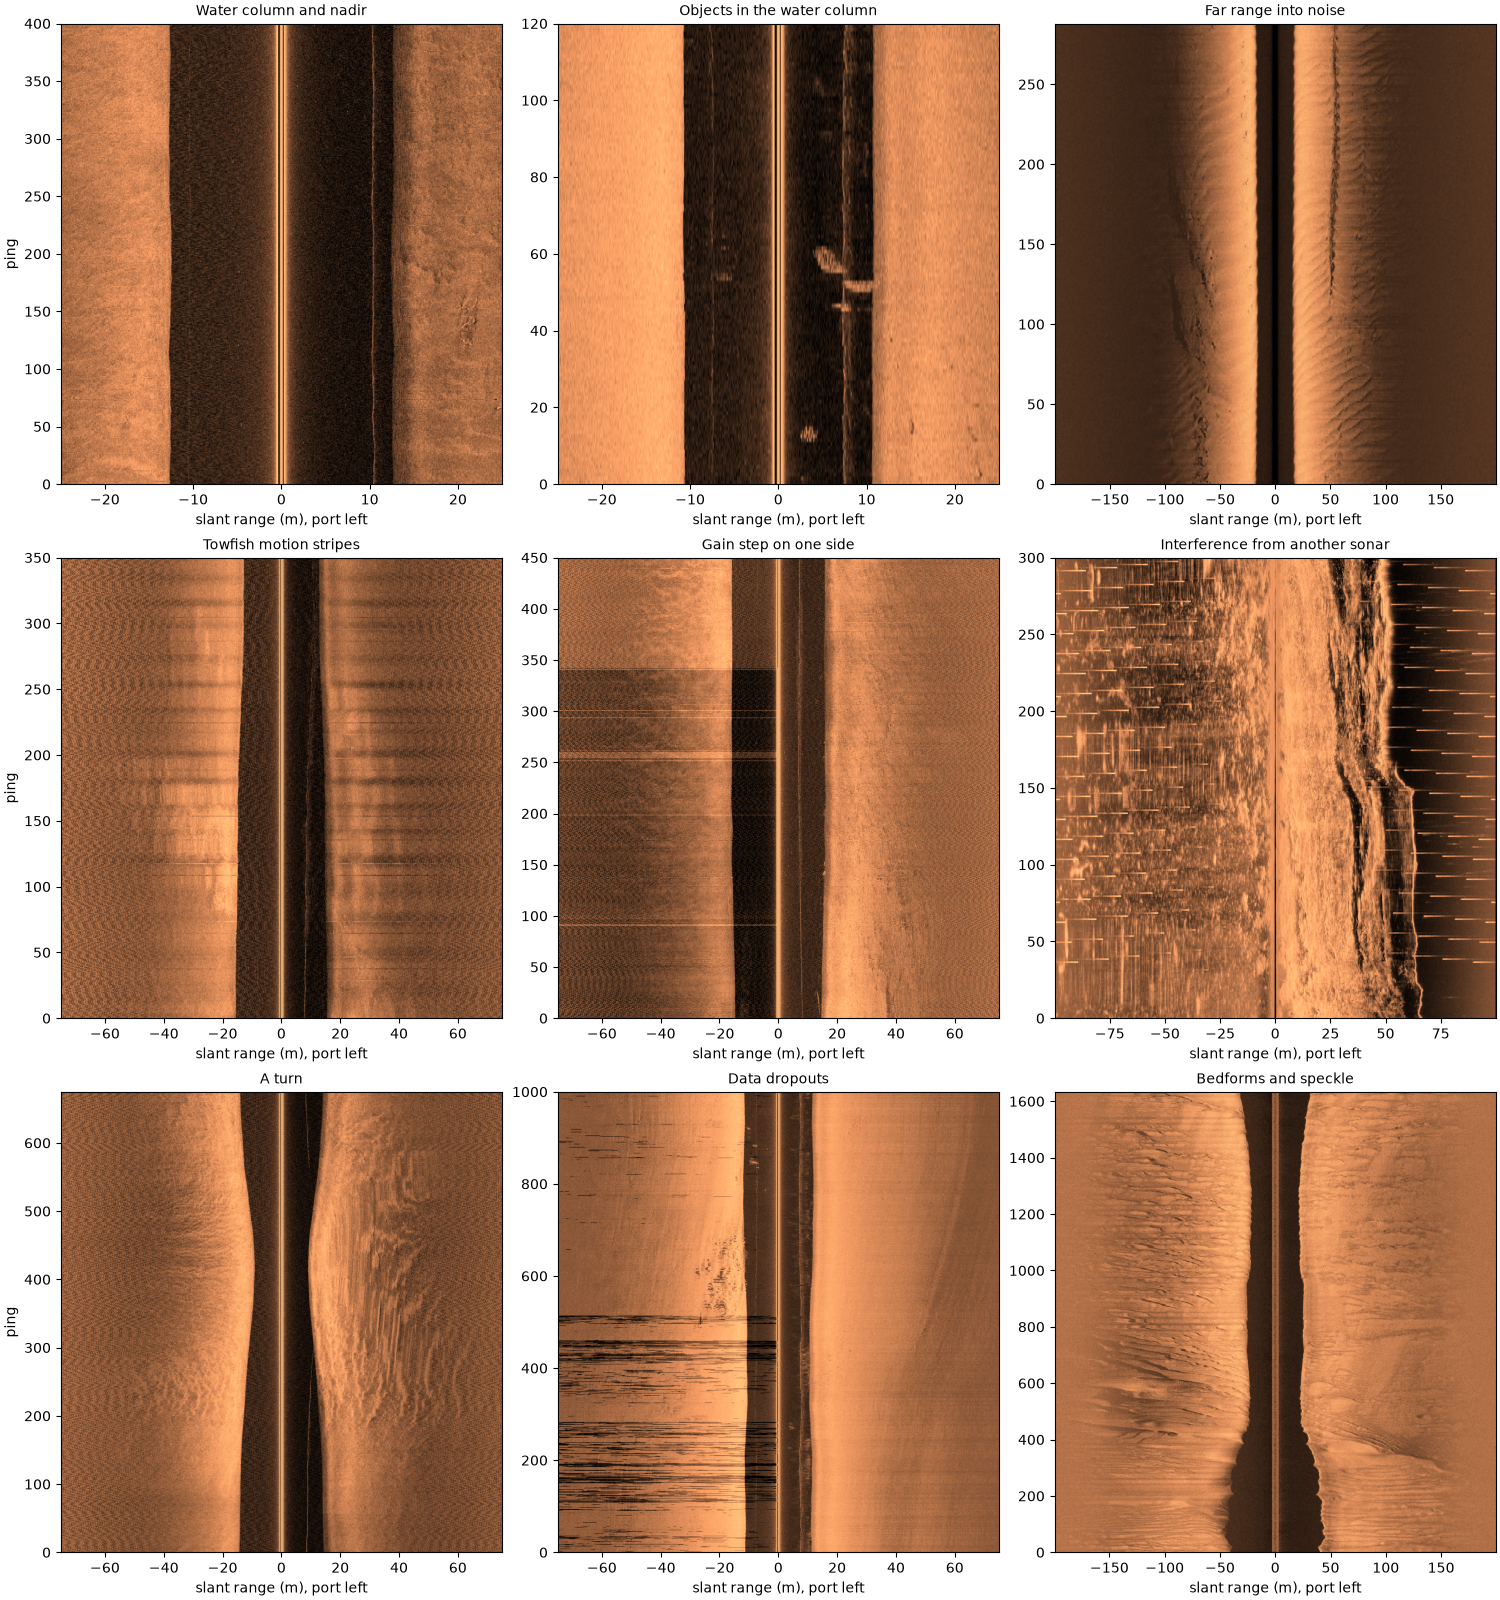
Much of what a sidescan image shows is not seabed. The towfish moves, the recorder changes its gain, other sonars ping, the GPS updates slowly and the signal fades into noise at long range. Each leaves its own mark, and an analyst or a detector trained on images sees all of them. This page shows the common ones on public recordings, with what causes each, a number that tells it apart, and what sidescanpy offers for it.
The first figure shows them all side by side. Each section then shows one of them larger, with the artifact boxed and labeled, a zoom where it is small, and, where geometry or navigation is the cause, the same pings placed on a map. Every native image is drawn the same way: ping by slant range, the samples as recorded (the recorder’s own gain, no TVG added) in dB, port on the left. Most of these can only be found, fixed or masked with the raw pings and the aux data, before the image is cut into tiles.
Data: BGS London Gateway (Open Government Licence v3.0, contains data supplied by UKRI), USGS Grand Bay (U.S. public domain), JNCC Wight-Barfleur Reef and mid-Irish Sea (Open Government Licence v3.0); see Example data.
Usage: python examples/theory/plot_common_artifacts.py [output_dir]
# 2026 rshomberg@uri.edu

import sys
from pathlib import Path

import matplotlib.pyplot as plt
import numpy as np
from matplotlib.patches import Rectangle
from pyproj import Transformer
from scipy.ndimage import median_filter

from sidescanpy import analysis, datasets
from sidescanpy.export.windows.levels import with_db_var
from sidescanpy.grids import grid_channel
from sidescanpy.io import read_and_convert
from sidescanpy.log import configure_logging
from sidescanpy.processing import (
    altitude_from_bottom_track,
    aux_update_events,
    compute_geometric_ranges,
    compute_georeferencing,
    course_over_ground,
    interpolate_aux_onto_pings,
    slice_by_range,
    smooth_navigation,
)

out = Path(sys.argv[1]) if len(sys.argv) > 1 else Path(".")
out.mkdir(parents=True, exist_ok=True)
# The readers warn about known quirks of these files (sample scaling,
# sound velocity); see the source format pages.
configure_logging("ERROR")

MARK = "#00e5ff"  # label colour, chosen to stand out on the copper images


def line(name, freq_key=None):
    """One frequency of a public line, as recorded."""
    survey = read_and_convert([datasets.fetch(name)], fmt="xtf", nav_crs="EPSG:32631")
    return survey, survey.get_frequency(freq_key or survey.frequencies[-1]).dataset


def native(ds, pings, half_range_m):
    """Ping-by-signed-slant-range image in dB (port left), its extent and the sample size."""
    ds = ds.isel(ping=slice(*pings))
    sound = float(np.nanmedian(ds["sound_vel_ms"].values))
    sample_m = (sound if sound > 1000 else 1500.0) / (2 * ds.attrs["sample_rate_hz"])
    n = min(int(half_range_m / sample_m), ds.sizes["sample"])
    amp = np.abs(ds["backscatter_intensity"].values[:, :, :n].astype(float))
    db = 20 * np.log10(np.concatenate([amp[:, 0, ::-1], amp[:, 1]], axis=1) + 1.0)
    first = int(ds["ping"].values[0])
    return db, [-n * sample_m, n * sample_m, first, first + db.shape[0]], sample_m


def show(ax, image, extent, title, xlabel="slant range (m), port left", clim=None):
    ax.set_facecolor("0.85")  # samples with no value (no ground range) show grey
    lo, hi = clim if clim is not None else np.nanpercentile(image, [1, 99.5])
    ax.imshow(image, cmap="copper", vmin=lo, vmax=hi, origin="lower", aspect="auto", extent=extent,
              interpolation="antialiased")
    ax.set_title(title, fontsize=10)
    ax.set_xlabel(xlabel)
    return lo, hi


def side_levels(db, n_side, near, far, sample_m):
    """Per-ping median dB of each side between ``near`` and ``far`` metres of slant range."""
    a, b = int(near / sample_m), int(far / sample_m)
    port = np.median(db[:, n_side - b:n_side - a], axis=1)
    stbd = np.median(db[:, n_side + a:n_side + b], axis=1)
    return port, stbd


def mark(ax, x0, x1, y0, y1, text, inside=False, dashed=False, ha="left"):
    """Box a feature and label it, above the box or just inside its top."""
    ax.add_patch(Rectangle((x0, y0), x1 - x0, y1 - y0, fill=False, ec=MARK, lw=1.6,
                           ls="--" if dashed else "-"))
    if text:
        ax.text(x0 if ha == "left" else x1, y1, text, color=MARK, fontsize=9, fontweight="bold", ha=ha,
                va="top" if inside else "bottom", clip_on=True,
                bbox=dict(fc="black", alpha=0.6, ec="none", pad=1.5))


def zoom(ax, image, extent, clim, box, title, xlabel="slant range (m), port left"):
    """The same image cropped to ``box`` (x0, x1, y0, y1), with the full image's colour scale."""
    show(ax, image, extent, title, xlabel=xlabel, clim=clim)
    ax.set_xlim(box[0], box[1])
    ax.set_ylim(box[2], box[3])


def ground_view(ds, pings, half_range_m, cell_m=0.1):
    """Ping-by-signed-ground-range image in dB: the water column has no ground range."""
    ds = compute_geometric_ranges(altitude_from_bottom_track(ds.isel(ping=slice(*pings)).load()))
    ground = ds["ground_range_m"].values
    db = 20 * np.log10(np.abs(ds["backscatter_intensity"].values.astype(float)) + 1.0)
    axis = np.arange(cell_m / 2, half_range_m, cell_m)
    image = np.full((ds.sizes["ping"], 2, axis.size), np.nan)
    for p in range(ds.sizes["ping"]):
        for c in range(2):
            ok = np.isfinite(ground[p, c])
            if ok.sum() > 1:
                image[p, c] = np.interp(axis, ground[p, c, ok], db[p, c, ok], left=np.nan, right=np.nan)
    first = int(ds["ping"].values[0])
    return (np.concatenate([image[:, 0, ::-1], image[:, 1]], axis=1),
            [-half_range_m, half_range_m, first, first + ds.sizes["ping"]])


def north_up(survey, pings, max_m, *, interpolate=True, course=False, cell_m=0.5, max_hold_s=2.0):
    """Grid a stretch of pings onto a north-up map (local metres from the grid centre).

    ``interpolate`` rebuilds positions between the real fixes; without it
    the positions are used as recorded; ``max_hold_s`` is passed on to
    :func:`~sidescanpy.processing.interpolate_aux_onto_pings`. ``course`` smooths the navigation
    and uses the course over ground as heading, for files with no compass.
    """
    if interpolate:
        survey = interpolate_aux_onto_pings(survey, max_hold_s=max_hold_s)
    if course:
        survey = smooth_navigation(survey, window_s=5.0)
    ds = survey.get_frequency(survey.frequencies[-1]).dataset
    first, last = pings[0], pings[1] if pings[1] is not None else ds.sizes["ping"]
    margin = min(first, 100)  # neighbours for the course at the first pings
    ds = slice_by_range(ds.isel(ping=slice(first - margin, last + 100)), max_m=max_m).load()
    if course:
        ds = ds.assign(heading_deg=("ping", course_over_ground(ds, half_window_s=5.0)))
    ds = ds.isel(ping=slice(margin, margin + last - first))
    ds = with_db_var(compute_georeferencing(compute_geometric_ranges(altitude_from_bottom_track(ds))))
    raster = grid_channel(ds, resolution_m=cell_m, method="mean", backscatter_var="backscatter_db")
    x, y = raster.x_values, raster.y_values
    x0, y0 = float(np.mean(x)), float(np.mean(y))
    east, north = Transformer.from_crs(4326, raster.crs, always_xy=True).transform(
        ds["longitude"].values, ds["latitude"].values)
    half = cell_m / 2
    extent = [x.min() - x0 - half, x.max() - x0 + half, y.min() - y0 - half, y.max() - y0 + half]
    return raster.backscatter, extent, (east - x0, north - y0)


def show_map(ax, grid, extent, track, title):
    lo, hi = np.nanpercentile(grid, [1, 99.5])
    ax.set_facecolor("0.85")
    ax.imshow(grid, cmap="copper", vmin=lo, vmax=hi, origin="lower", extent=extent, interpolation="nearest")
    ax.plot(*track, color=MARK, lw=1.0, ls=":", label="towfish track")
    ax.set_aspect("equal")
    ax.set_xlabel("east (m)")
    ax.set_ylabel("north (m)")
    ax.set_title(title, fontsize=10)
Load the lines#
Nine short stretches from seven public lines, each chosen because it shows one artifact clearly.
_, aisha05 = line("bgs_london_gateway_aisha_05.xtf")
_, ash11 = line("bgs_london_gateway_ash_11.xtf")
_, barfleur_h = line("jncc_wight_barfleur_20130321174522H.xtf")
aisha15_survey, aisha15 = line("bgs_london_gateway_aisha_15.xtf")
_, grand_bay = line("usgs_grand_bay_150602133300.xtf", "hz_100000")
aisha16_survey, aisha16 = line("bgs_london_gateway_aisha_16.xtf")
_, ash34 = line("bgs_london_gateway_ash_34.xtf")
_, irish_sea = line("jncc_mid_irish_sea_MIS15_2.xtf", "hz_400000")
barfleur_l_survey, barfleur_l = line("jncc_wight_barfleur_20130321174522L.xtf")

PANELS = [
    ("Water column and nadir", aisha05, (1600, 2000), 25),
    ("Objects in the water column", ash11, (600, 720), 25),
    ("Far range into noise", barfleur_h, (0, None), 200),
    ("Towfish motion stripes", aisha15, (600, 950), 75),
    ("Gain step on one side", aisha05, (0, 450), 75),
    ("Interference from another sonar", grand_bay, (400, 700), 100),
    ("A turn", aisha16, (0, 675), 75),
    ("Data dropouts", ash34, (0, 1000), 75),
    ("Bedforms and speckle", irish_sea, (0, None), 200),
]
images = {title: native(ds, pings, r) for title, ds, pings, r in PANELS}

fig, axes = plt.subplots(3, 3, figsize=(15, 16), constrained_layout=True)
for ax, (title, (db, extent, _)) in zip(axes.flat, images.items()):
    show(ax, db, extent, title)
for ax in axes[:, 0]:
    ax.set_ylabel("ping")
fig.savefig(out / "common_artifacts.png", dpi=150)
Water column and nadir#
Until the sound reaches the seabed under the towfish there is nothing to echo, so every ping starts with a dark band as wide as the towfish’s altitude. The faint line inside it on the starboard side, at about 10 m, is likely the echo from the sea surface (not confirmed). In ground range, right, the water column has no position: the band and the surface line are gone, and each side starts close to the track. The narrow grey strip left in the middle, about 1 m either side, is ground no sample maps to: there a small step in slant range covers a large step in ground range, so the first seabed samples are spread thin.
What to do: analyze_nadir() finds the
first bottom return on every ping, the bottom_track step fills a
missing altitude from it, and
compute_geometric_ranges() gives the
water column no ground range.
altitude = float(np.nanmedian(aisha05["altitude_m"].values[1600:2000]))
print(f"recorded altitude: {altitude:.1f} m")

db, extent, _ = images["Water column and nadir"]
ground, ground_extent = ground_view(aisha05, (1600, 2000), 25)
fig, (ax_n, ax_z, ax_g) = plt.subplots(1, 3, figsize=(15, 6.5), constrained_layout=True,
                                       gridspec_kw=dict(width_ratios=[2, 1, 2]))
clim = show(ax_n, db, extent, "native (slant range)")
mark(ax_n, -altitude, altitude, 10, 390, "water column", inside=True)
surface_box = (8.5, 12.5, 100, 180)
mark(ax_n, *surface_box, "surface echo?", dashed=True)
zoom(ax_z, db, extent, clim, surface_box, "zoom: the faint line at about 10 m")
show(ax_g, ground, ground_extent, "ground range: the water column is gone", xlabel="ground range (m), port left")
for ax in (ax_n, ax_z):
    ax.set_ylabel("ping")
fig.savefig(out / "common_artifacts_water_column.png", dpi=150)
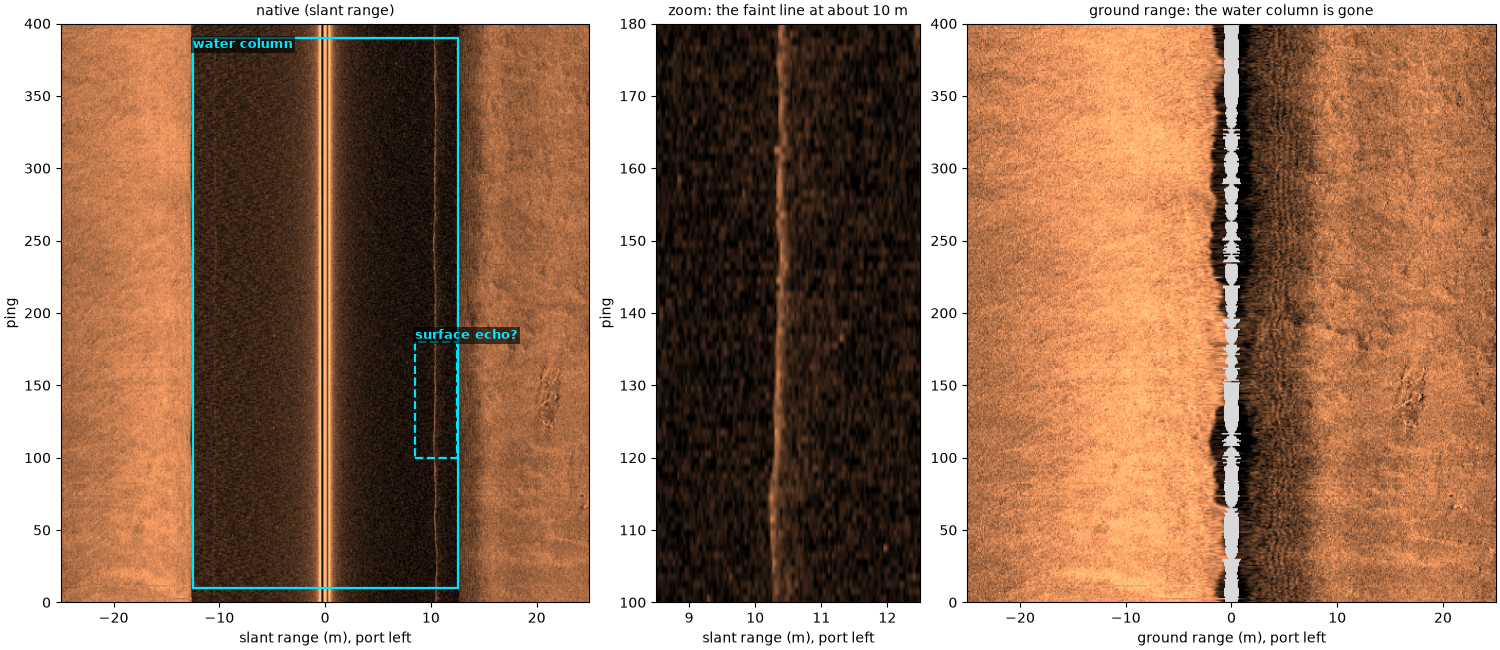
recorded altitude: 12.5 m
Objects in the water column#
The boxed blobs inside the dark band are echoes from things in the water between the towfish and the seabed: fish, a school or debris. They are real echoes, but not seabed. In ground range, and on a map, they are dropped with the rest of the water column; on a tile cut from the native image they look like objects on the bottom.
db, extent, sample_m = images["Objects in the water column"]
water_altitude = float(np.nanmedian(ash11["altitude_m"].values[600:720]))
print(f"recorded altitude: {water_altitude:.1f} m")
# Echoes inside the water column, located by eye on this image:
# (near, far slant range in m, signed; first, last ping).
BLOBS = [(2.4, 5.4, 9, 17), (3.2, 6.4, 54, 65), (6.4, 10.0, 49, 56), (6.6, 8.2, 43, 49),
         (-7.2, -4.8, 51, 57)]

ground, ground_extent = ground_view(ash11, (600, 720), 25)
fig, (ax_n, ax_z, ax_g) = plt.subplots(1, 3, figsize=(15, 6), constrained_layout=True,
                                       gridspec_kw=dict(width_ratios=[2, 1, 2]))
clim = show(ax_n, db, extent, "native (slant range)")
for k, (x0, x1, y0, y1) in enumerate(BLOBS):
    mark(ax_n, x0, x1, y0, y1, "in water" if k == 0 else "")
zoom(ax_z, db, extent, clim, (1, 11, 38, 70), "zoom: pings 38 to 70")
show(ax_g, ground, ground_extent, "ground range: dropped with the water column", xlabel="ground range (m), port left")
for ax in (ax_n, ax_z):
    ax.set_ylabel("ping")
fig.savefig(out / "common_artifacts_water_objects.png", dpi=150)
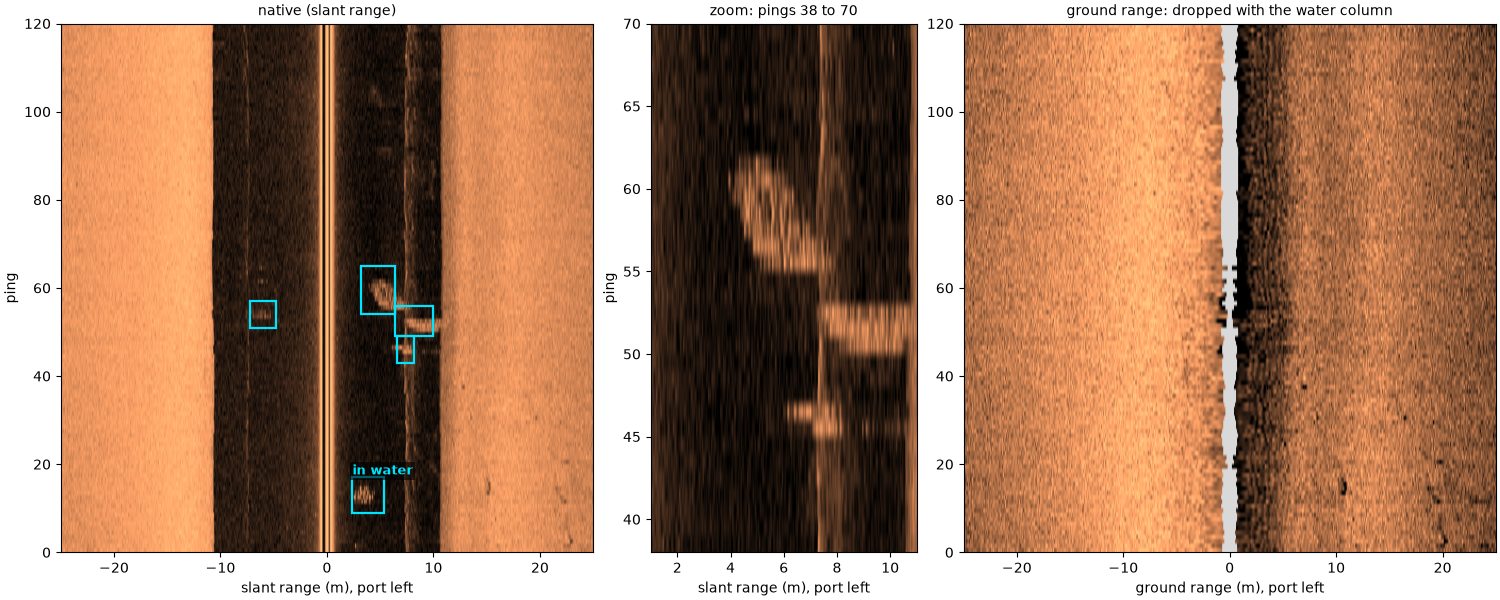
recorded altitude: 10.8 m
Far range into noise#
The echo weakens with range by spreading and absorption, and absorption grows with frequency. At about 547 kHz this line’s seabed sinks into the receiver noise long before the 200 m the recorder kept, and the outer part of the swath (boxed) is noise, not dark seabed. The level along range, right, stops falling where the noise takes over.
What to do: estimate_usable_range()
finds where the level stops falling (its default, the noise knee);
crop or mask beyond it
(crop_far_range_noise()).
channel = compute_geometric_ranges(altitude_from_bottom_track(barfleur_h.load()))
usable = analysis.estimate_usable_range(channel, value_var="backscatter_intensity", bin_width_m=2.0)
print(f"usable range {usable.usable_range_m:.0f} m of {float(channel['slant_range_m'].max()):.0f} m recorded")
del channel

db, extent, sample_m = images["Far range into noise"]
n_side = db.shape[1] // 2
ranges = (np.arange(n_side) + 0.5) * sample_m
fig, (ax_n, ax_l) = plt.subplots(1, 2, figsize=(14, 6), constrained_layout=True)
show(ax_n, db, extent, "native (slant range)")
u = usable.usable_range_m
for x0, x1, ha in ((extent[0], -u, "left"), (u, extent[1], "right")):
    mark(ax_n, x0, x1, extent[2] + 3, extent[3] - 3, "noise", inside=True, ha=ha)
ax_n.set_ylabel("ping")
ax_l.plot(ranges, np.median(db[:, n_side - 1::-1], axis=0), lw=0.8, label="port")
ax_l.plot(ranges, np.median(db[:, n_side:], axis=0), lw=0.8, label="starboard")
ax_l.axvline(u, color="k", ls="--", lw=1)
ax_l.text(u + 2, ax_l.get_ylim()[1], f"usable range {u:.0f} m (noise knee)", va="top", fontsize=9)
ax_l.set_xlabel("slant range (m)")
ax_l.set_ylabel("median level over all pings (dB)")
ax_l.legend()
fig.savefig(out / "common_artifacts_far_range.png", dpi=150)
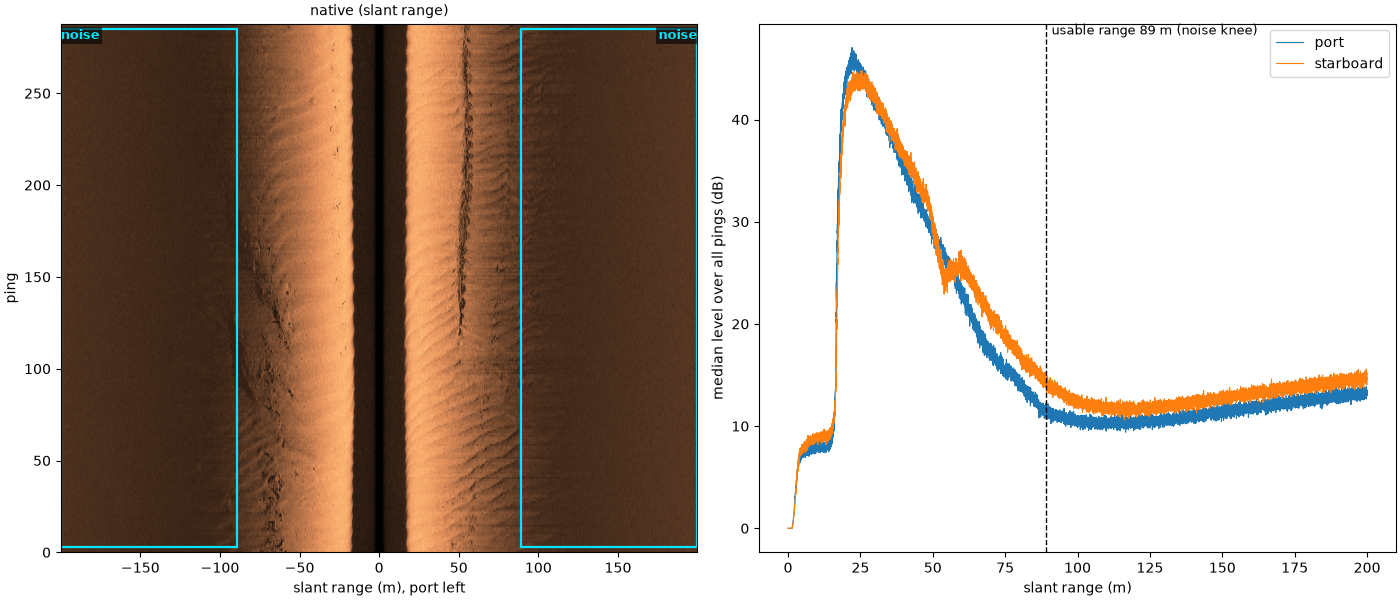
usable range 89 m of 200 m recorded
Towfish motion stripes#
Bright and dark bands cross the whole swath every 20 pings or so, on both sides at once. The towfish is pitching or heaving in the waves, tilting its beams on and off the seabed. Port and starboard brighten and dim together, which seabed would not do; this file records no pitch or heave to confirm it. On the map the stripes stay, because each band is a set of pings, not a place on the seabed. This stretch is slow and slightly curved (the printed track length and course below), so the pings fan out and each band becomes a ray across the swath. This file records no heading, so the map uses the course over ground and no layback; the white streaks on the outer edge of the curve are gaps between pings.
What to do: no correction; know it is there. A detector will see stripes at the wave period.
db, extent, sample_m = images["Towfish motion stripes"]
port, stbd = side_levels(db, db.shape[1] // 2, 20, 60, sample_m)


def detrend(x, window=61):
    return x - np.convolve(np.pad(x, window // 2, mode="edge"), np.ones(window) / window, mode="valid")


r = np.corrcoef(detrend(port), detrend(stbd))[0, 1]
print(f"port and starboard levels, ping to ping: correlation {r:.2f}")

grid, map_extent, track = north_up(aisha15_survey, (600, 950), 75, course=True)
start = np.degrees(np.arctan2(track[0][30] - track[0][0], track[1][30] - track[1][0]))
end = np.degrees(np.arctan2(track[0][-1] - track[0][-31], track[1][-1] - track[1][-31]))
length = np.sum(np.hypot(np.diff(track[0]), np.diff(track[1])))
print(f"track over these {len(track[0])} pings: {length:.0f} m; course {start % 360:.0f} deg at the start, "
      f"{end % 360:.0f} deg at the end")
fig, (ax_n, ax_z, ax_m) = plt.subplots(1, 3, figsize=(16, 6.5), constrained_layout=True,
                                       gridspec_kw=dict(width_ratios=[2, 1.4, 2]))
clim = show(ax_n, db, extent, "native (slant range)")
stripe_box = (-60, 60, 160, 260)
mark(ax_n, *stripe_box, "stripes on both sides", dashed=True)
zoom(ax_z, db, extent, clim, stripe_box, "zoom: pings 160 to 260")
show_map(ax_m, grid, map_extent, track, "north-up map, 0.5 m cells")
mark(ax_m, 18, 74, 20, 82, "stripes become rays", inside=True)
ax_m.legend(loc="lower right", fontsize=8)
for ax in (ax_n, ax_z):
    ax.set_ylabel("ping")
fig.savefig(out / "common_artifacts_motion_stripes.png", dpi=150)
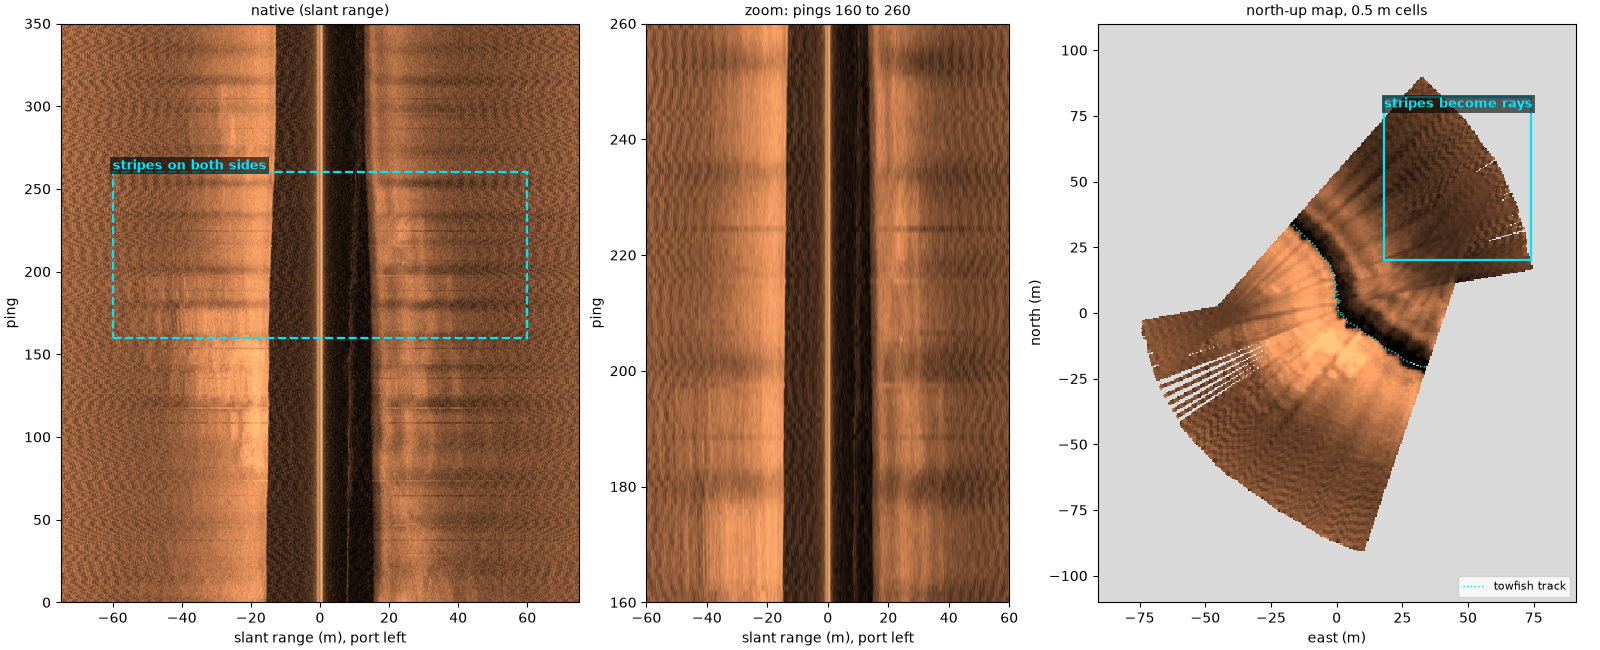
port and starboard levels, ping to ping: correlation 0.81
track over these 350 pings: 91 m; course 288 deg at the start, 314 deg at the end
Gain step on one side#
For the first 340 pings the port side is about 8 dB darker than the rest of the line, then it jumps back; starboard does not change. The recorder changed the port receiver’s gain. A few pings, single or in one short run near ping 255, are bright across the port swath (arrows): the same kind of event lasting a ping or a few. Neither is in the seabed. The level of each side along the line, right, shows both.
db, extent, sample_m = images["Gain step on one side"]
port, stbd = side_levels(db, db.shape[1] // 2, 20, 60, sample_m)
pings = np.arange(extent[2], extent[3])
spikes = pings[(port - median_filter(port, size=15) > 3.0) & (np.abs(pings - 340) > 3)]
print(f"port minus starboard: {np.median(port[:300] - stbd[:300]):+.1f} dB before ping 340, "
      f"{np.median(port[360:] - stbd[360:]):+.1f} dB after")
print(f"pings more than 3 dB above their neighbours on port: {spikes.tolist()}")

fig, (ax_n, ax_l) = plt.subplots(1, 2, figsize=(14, 6.5), constrained_layout=True, sharey=True,
                                 gridspec_kw=dict(width_ratios=[1.4, 1]))
show(ax_n, db, extent, "native (slant range)")
mark(ax_n, -58, -16, 2, 338, "port gain about 8 dB lower", inside=True)
for p in spikes:
    ax_n.annotate("", xy=(-60, p + 0.5), xytext=(-74, p + 0.5),
                  arrowprops=dict(arrowstyle="->", color=MARK, lw=1.4))
ax_n.text(-74, 352, "bright pings (arrows)", color=MARK, fontsize=9,
          fontweight="bold", bbox=dict(fc="black", alpha=0.6, ec="none", pad=1.5))
ax_n.set_ylabel("ping")
ax_l.plot(port, pings, lw=0.8, label="port")
ax_l.plot(stbd, pings, lw=0.8, label="starboard")
ax_l.set_xlabel("median level, 20-60 m (dB)")
ax_l.set_title("level of each side along the line", fontsize=10)
ax_l.legend()
fig.savefig(out / "common_artifacts_gain_step.png", dpi=150)
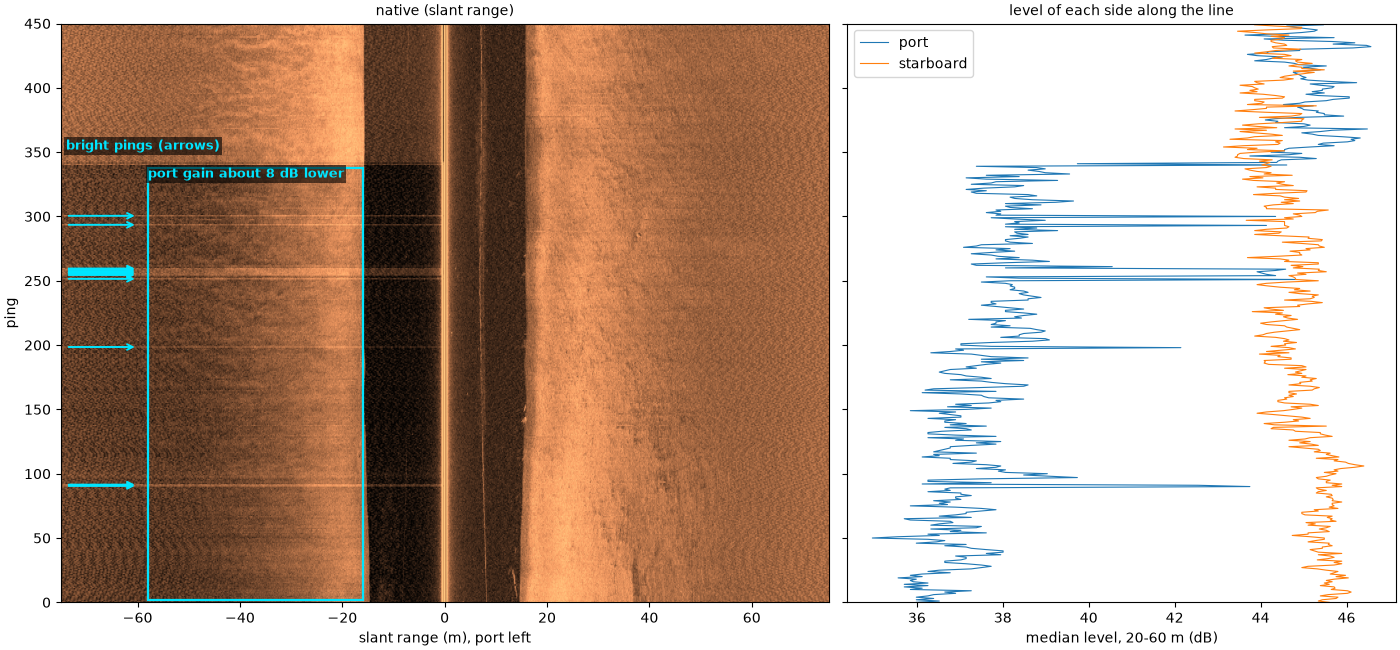
port minus starboard: -7.6 dB before ping 340, +0.9 dB after
pings more than 3 dB above their neighbours on port: [90, 91, 198, 251, 254, 255, 256, 257, 258, 259, 293, 300]
What to do: plot each side’s level along the line, as above, before
trusting levels between parts of a survey. Single bright pings can be
masked with mask_bright_ping_rows(); a long
step has to be handled as two pieces of data.
Interference from another sonar#
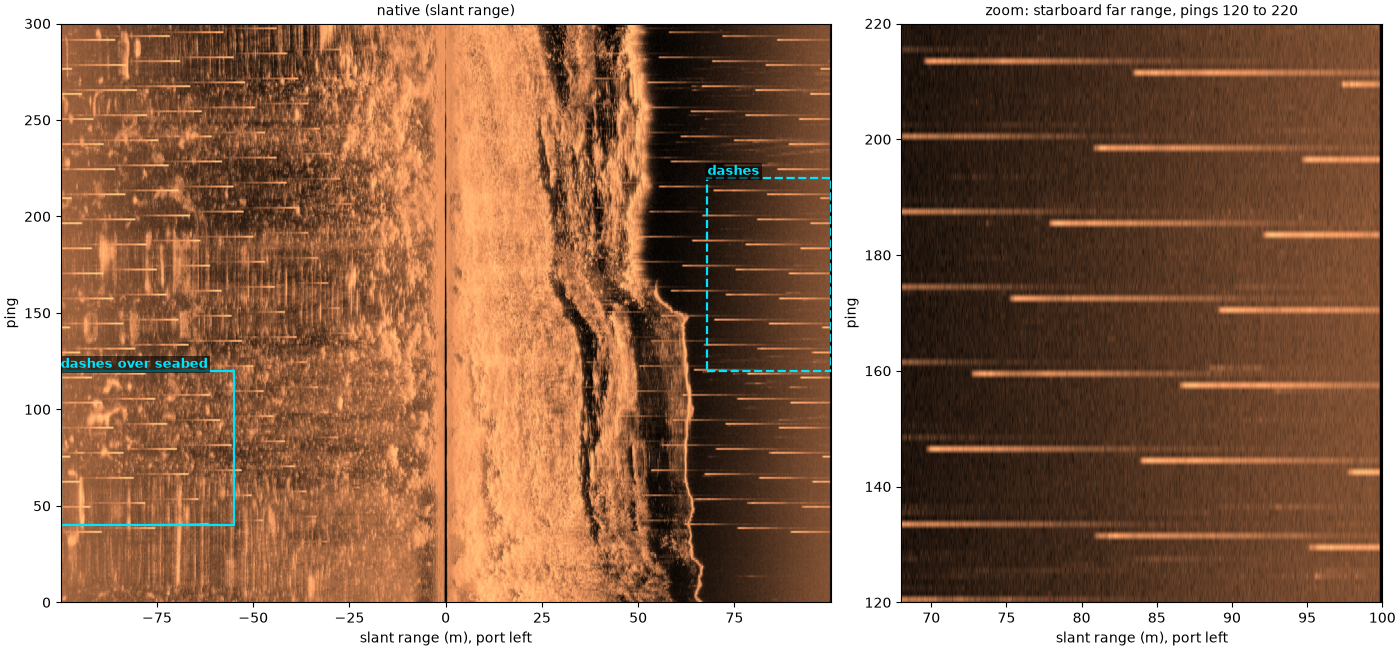
Short bright dashes at a fixed range scatter across both sides, repeating every few pings and stepping in range from one to the next. Another sonar on the same survey (here most likely the sub-bottom profiler) pings out of step with this one, and its pulses arrive at times unrelated to the seabed. The zoom shows the dashes on the dark far range of the starboard side, where nothing else is bright.
What to do: nothing in sidescanpy removes them. A median filter across pings does, but it also smooths small real objects; masking them needs the other sonar’s ping times.
db, extent, _ = images["Interference from another sonar"]
fig, (ax_n, ax_z) = plt.subplots(1, 2, figsize=(14, 6.5), constrained_layout=True,
                                 gridspec_kw=dict(width_ratios=[1.6, 1]))
clim = show(ax_n, db, extent, "native (slant range)")
dash_box = (68, 100, 120, 220)
mark(ax_n, *dash_box, "dashes", dashed=True)
mark(ax_n, -100, -55, 40, 120, "dashes over seabed")
zoom(ax_z, db, extent, clim, dash_box, "zoom: starboard far range, pings 120 to 220")
for ax in (ax_n, ax_z):
    ax.set_ylabel("ping")
fig.savefig(out / "common_artifacts_interference.png", dpi=150)
A turn#
The towfish swings through a turn of about 160°. It slows and sinks, so the water column narrows; the inner side is smeared as pings overlap, and the outer side fans apart, leaving gaps between pings at long range. The map shows where that leaves the seabed: the inner swath folds over itself near the centre of the turn and the outer swath is a fan of separate ping lines with empty cells between them. Turns also break the assumptions behind course over ground and a straight-astern layback; with no heading recorded, this map uses the course over ground and no layback, so its inner side is only roughly placed.
heading = np.unwrap(np.radians(aisha16["heading_deg"].values[:675]))
print(f"heading change over the turn: {np.degrees(heading[-1] - heading[0]):+.0f} deg")

db, extent, _ = images["A turn"]
grid, map_extent, track = north_up(aisha16_survey, (0, 675), 75, course=True)
print(f"turn map: {np.isfinite(grid).mean():.0%} of the grid's bounding box has data")
fig, (ax_n, ax_m) = plt.subplots(1, 2, figsize=(15, 7), constrained_layout=True,
                                 gridspec_kw=dict(width_ratios=[1, 1.4]))
show(ax_n, db, extent, "native (slant range)")
ax_n.set_ylabel("ping")
mark(ax_n, 14, 74, 300, 560, "inner side: smeared", inside=True)
mark(ax_n, -74, -14, 300, 560, "outer side", inside=True)
show_map(ax_m, grid, map_extent, track, "north-up map, 0.5 m cells")
mark(ax_m, -20, 55, -48, 0, "inner side: pings overlap")
mark(ax_m, 100, 142, -62, -12, "outer: gaps", ha="right")
ax_m.legend(loc="lower right", fontsize=8)
fig.savefig(out / "common_artifacts_turn.png", dpi=150)
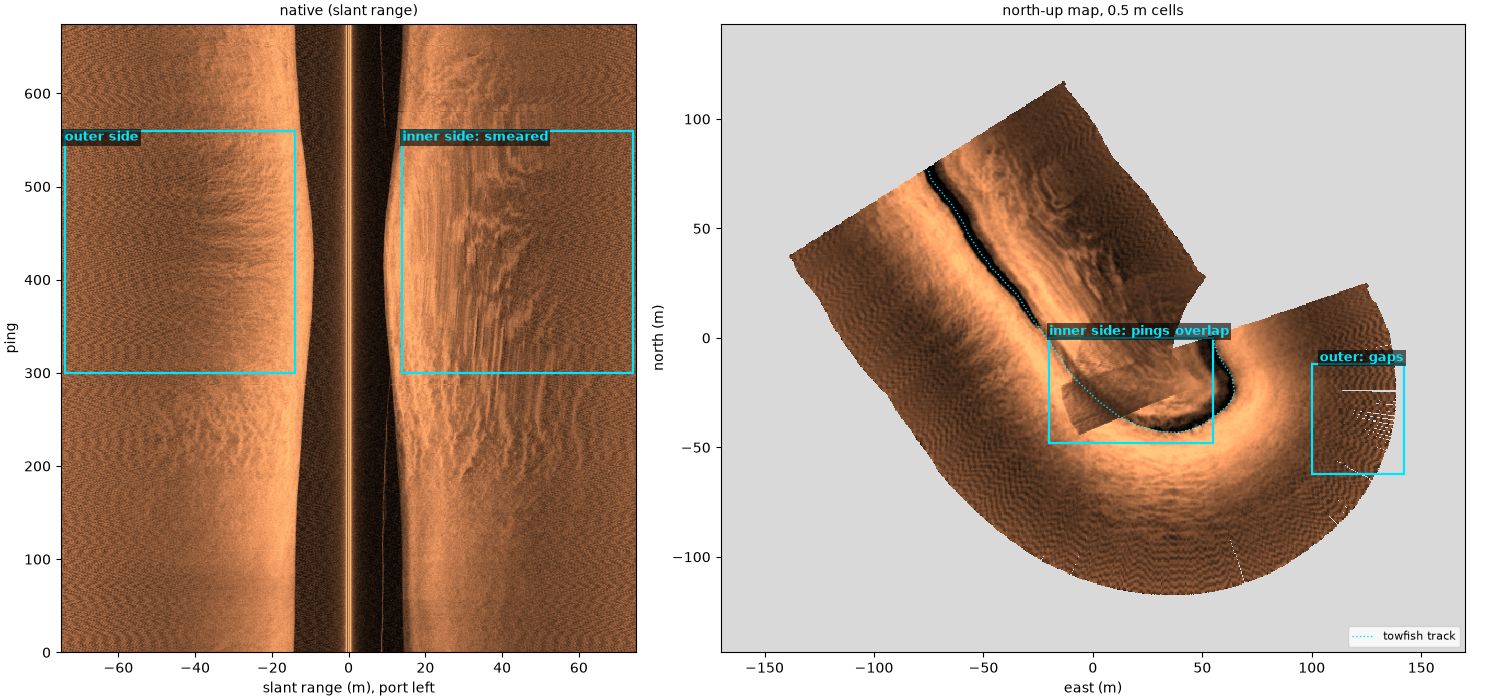
heading change over the turn: +167 deg
turn map: 37% of the grid's bounding box has data
What to do: keep turns out of mosaics and training sets.
split_by_segments() cuts a line into
clean segments.
Data dropouts#
Black streaks on the port side only: runs of samples far below anything the seabed returns, from a recording or telemetry loss (the file does not say which). They are not a very dark seabed; they carry no measurement. Each streak is a few pings tall and runs along range, which the zoom shows.
amp = np.abs(ash34["backscatter_intensity"].values[:1000, :, 500:2500].astype(float))
typical = np.median(amp, axis=(0, 2))
low = amp < 0.05 * typical[None, :, None]
print(f"typical level: port {typical[0]:.0f}, starboard {typical[1]:.0f} (counts); "
      f"samples under 5 % of it: port {low[:, 0].mean():.2%}, starboard {low[:, 1].mean():.2%}")
del amp, low

db, extent, _ = images["Data dropouts"]
fig, (ax_n, ax_z) = plt.subplots(1, 2, figsize=(14, 6.5), constrained_layout=True,
                                 gridspec_kw=dict(width_ratios=[1.4, 1]))
clim = show(ax_n, db, extent, "native (slant range)")
mark(ax_n, -74, -1, 5, 520, "dropouts (port only)", inside=True)
drop_box = (-70, -20, 140, 220)
mark(ax_n, *drop_box, "", dashed=True)
zoom(ax_z, db, extent, clim, drop_box, "zoom: port, pings 140 to 220")
for ax in (ax_n, ax_z):
    ax.set_ylabel("ping")
fig.savefig(out / "common_artifacts_dropouts.png", dpi=150)
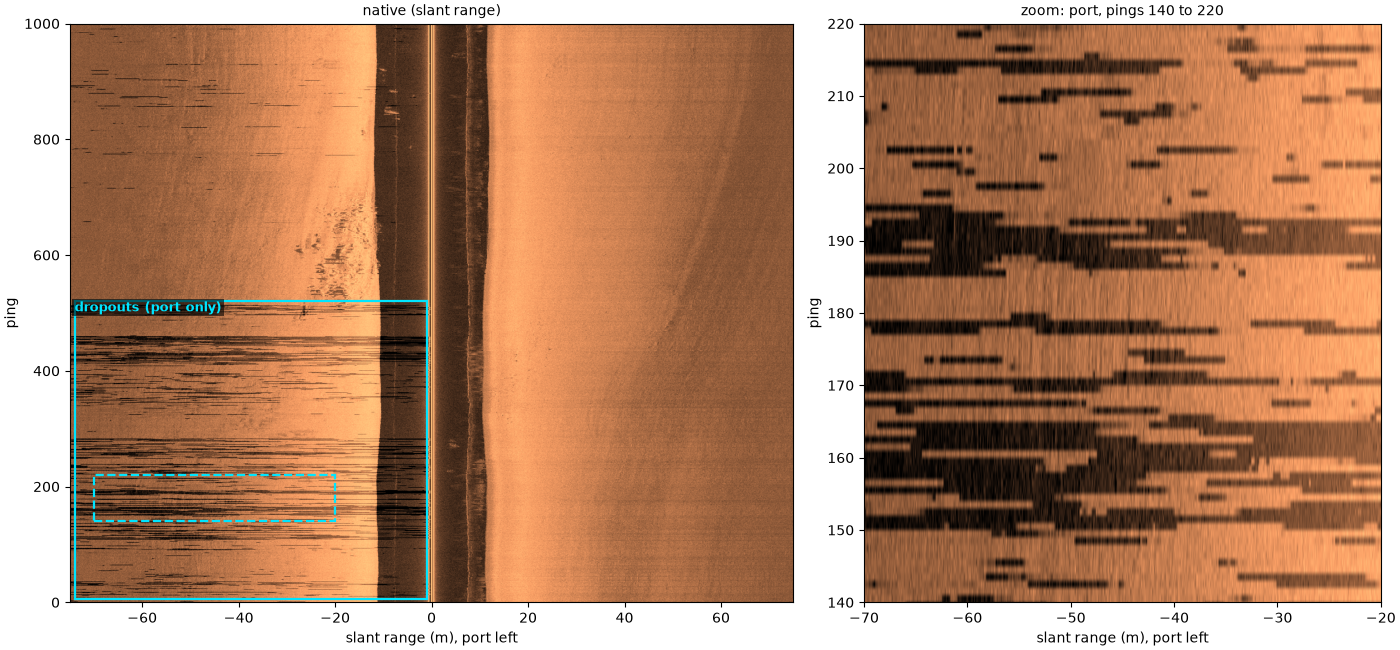
typical level: port 172, starboard 204 (counts); samples under 5 % of it: port 1.25%, starboard 0.00%
What to do: samples recorded as exactly zero are masked before
resampling (mask_dropouts()), so they
are interpolated over instead of spreading into dark spots. These
runs are low but not zero, and sidescanpy does not catch them yet;
mask them by level, as the line above counts them.
Navigation that is held, then jumps#
Not visible in the native image, but in every map: on this line the
per-ping position stays the same for seconds, then jumps by 20 m or
more. Placed by those positions, pings stack on top of each other and
then the image tears: the middle map is a row of separate strips, each
a pile of pings on one position, with empty gaps between them.
interpolate_aux_onto_pings() ramps the
positions between real fixes, but by default keeps a value held for
more than 2 s (max_hold_s) flat, as it would be for a stop. The
towfish was moving at about 6 knots throughout, so these holds are
gaps in the GPS, and max_hold_s=20 ramps through them, right. The
few slanted single lines in both maps are pings whose recorded heading
jumps by about 25 degrees from its neighbours.
Navigation: held fixes, interpolation and the track covers navigation in full.
stats = aux_update_events(barfleur_l_survey.navigation)["latitude"]
print(f"navigation record: position changes every {stats.change_gap_s['p50']:.1f} s (median)")
t = barfleur_l["time"].values.astype("datetime64[ns]").astype(np.int64) / 1e9
lat = barfleur_l["latitude"].values
changes = np.flatnonzero(np.diff(lat) != 0)
held = np.diff(t[changes]).max() if changes.size > 1 else 0.0
print(f"per-ping position held for up to {held:.0f} s")
speed = barfleur_l["speed_knots"].values if "speed_knots" in barfleur_l else barfleur_l_survey.navigation["speed_knots"].values
heading_jump = np.abs(np.diff(barfleur_l["heading_deg"].values)).max()
print(f"recorded speed {np.nanmin(speed):.1f} to {np.nanmax(speed):.1f} knots; "
      f"largest ping-to-ping heading change {heading_jump:.0f} deg")

nav_db, nav_extent, _ = native(barfleur_l, (0, None), 100)
held_grid, held_extent, held_track = north_up(barfleur_l_survey, (0, None), 100, interpolate=False, cell_m=1.0)
fixed_grid, fixed_extent, fixed_track = north_up(barfleur_l_survey, (0, None), 100, max_hold_s=20.0,
                                                 cell_m=1.0)
fig, (ax_n, ax_h, ax_f) = plt.subplots(1, 3, figsize=(16, 6.5), constrained_layout=True)
show(ax_n, nav_db, nav_extent, "native: no sign of the held positions")
ax_n.set_ylabel("ping")
show_map(ax_h, held_grid, held_extent, held_track, "map, positions as recorded (held), 1 m cells")
show_map(ax_f, fixed_grid, fixed_extent, fixed_track, "interpolated, max_hold_s=20, 1 m cells")
ax_f.legend(loc="lower right", fontsize=8)
fig.savefig(out / "common_artifacts_held_navigation.png", dpi=150)
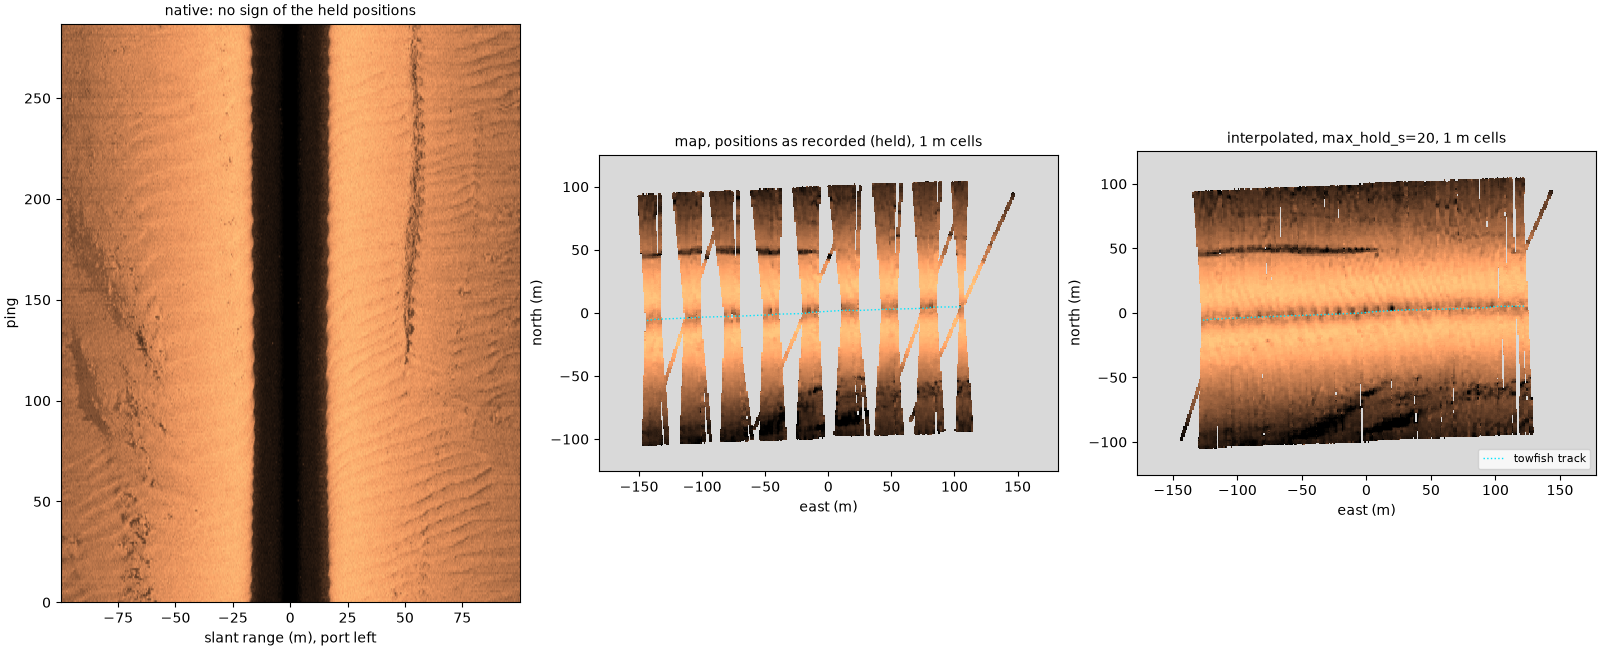
navigation record: position changes every 2.0 s (median)
per-ping position held for up to 18 s
recorded speed 5.9 to 6.2 knots; largest ping-to-ping heading change 27 deg
Bedforms and speckle#
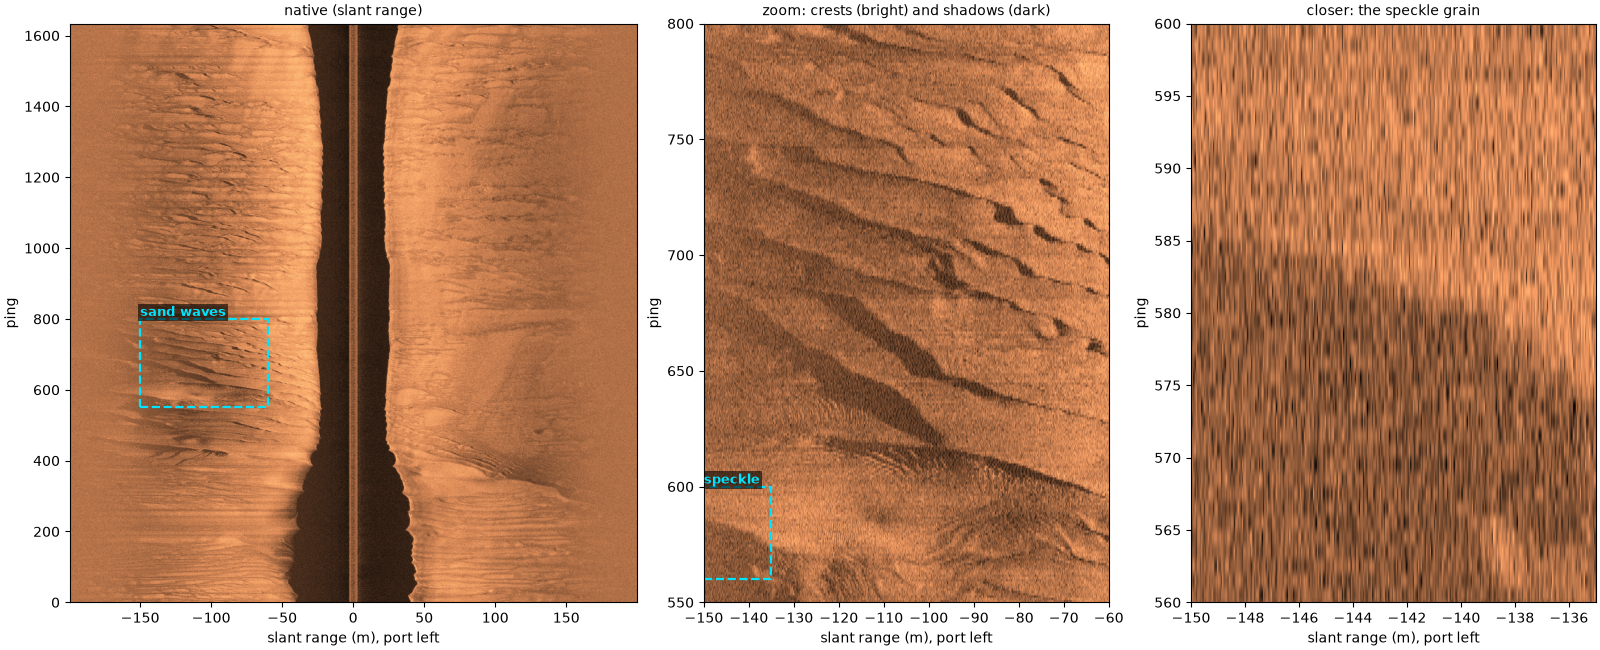
Sand waves on this mid-Irish Sea line: each crest is bright on the side facing the sonar and casts a shadow behind it, an object-sized bright and dark pair. Speckle, the grain over everything, comes from many small scatterers adding up with random phases; it is the grain inside every crest and trough, shown closer in the right panel. Both are real seabed, not artifacts, but they make the marks a detector has to learn to ignore.
db, extent, _ = images["Bedforms and speckle"]
fig, (ax_n, ax_z, ax_s) = plt.subplots(1, 3, figsize=(16, 6.5), constrained_layout=True,
                                       gridspec_kw=dict(width_ratios=[1.4, 1, 1]))
clim = show(ax_n, db, extent, "native (slant range)")
bed_box = (-150, -60, 550, 800)
mark(ax_n, *bed_box, "sand waves", dashed=True)
zoom(ax_z, db, extent, clim, bed_box, "zoom: crests (bright) and shadows (dark)")
speckle_box = (-150, -135, 560, 600)
mark(ax_z, *speckle_box, "speckle", dashed=True)
zoom(ax_s, db, extent, clim, speckle_box, "closer: the speckle grain")
for ax in (ax_n, ax_z, ax_s):
    ax.set_ylabel("ping")
fig.savefig(out / "common_artifacts_bedforms.png", dpi=150)
Not shown#
Some artifacts do not appear clearly in the public data used here: the towfish’s own wake and propeller bubbles crossed in a turn, sound reaching the seabed by a surface bounce (multipath), crosstalk between frequencies, and yaw.
Total running time of the script: (1 minutes 5.278 seconds)